Fig. 7.

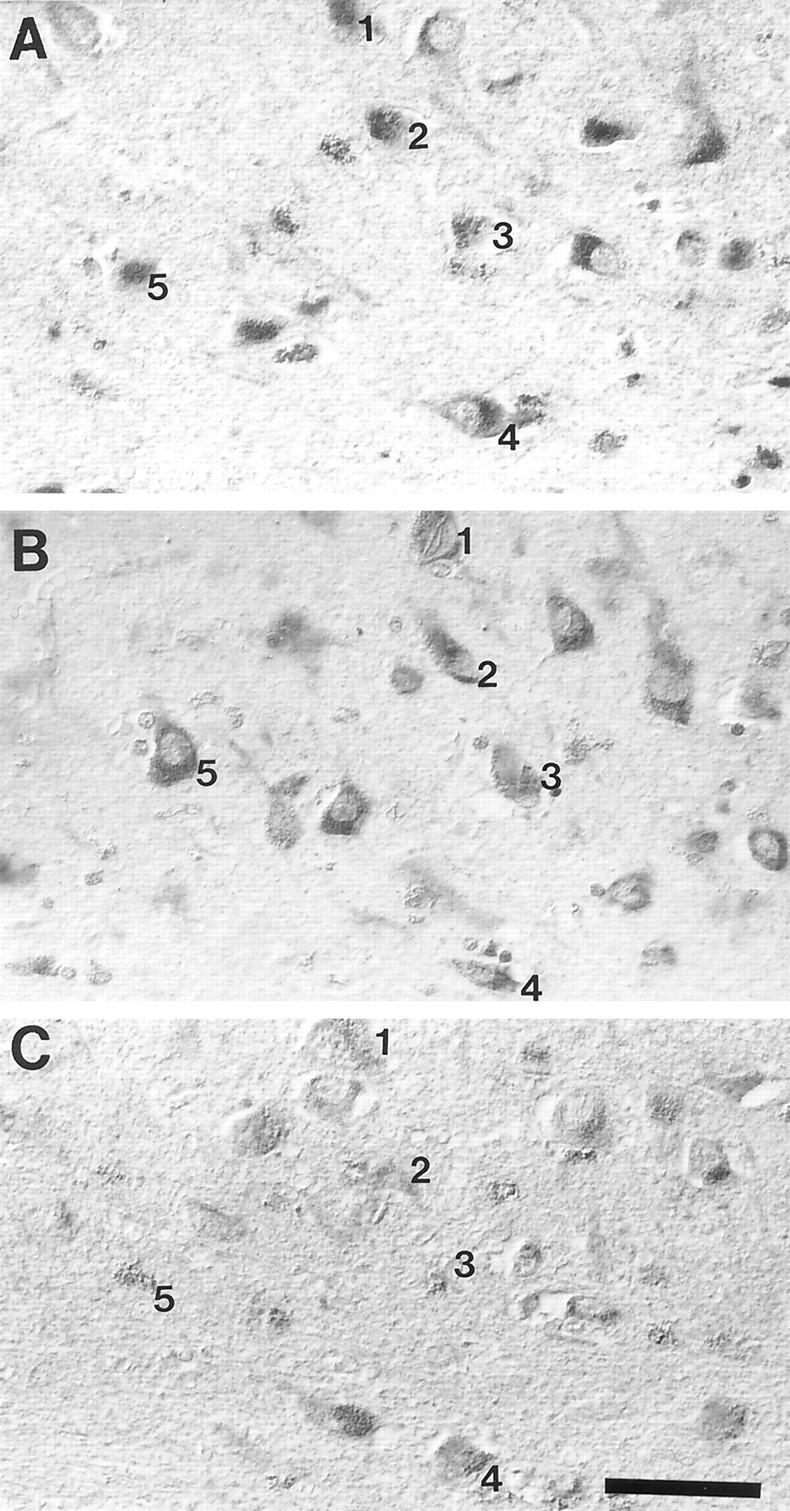
The distribution of neurons showing increased mtDNAΔ5kb (chimeric probe) (A), 8-OHG (B), and nitrotyrosine (C) immunoreactivity in AD completely overlaps. Numberindicates the same neurons in adjacent serial sections. Scale bar, 50 μm.

The distribution of neurons showing increased mtDNAΔ5kb (chimeric probe) (A), 8-OHG (B), and nitrotyrosine (C) immunoreactivity in AD completely overlaps. Numberindicates the same neurons in adjacent serial sections. Scale bar, 50 μm.