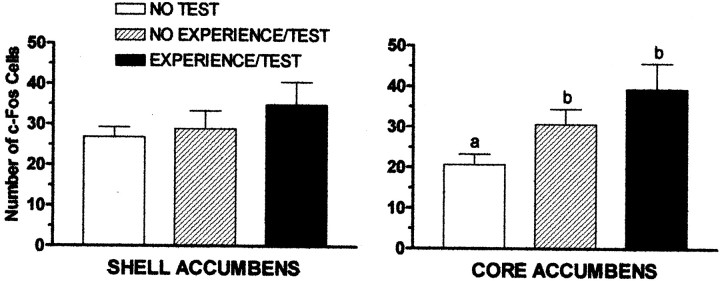
Fig. 3.
c-Fos expression in the shell and core of the nucleus accumbens, collapsed across the rostral–caudal level. The three-way ANOVA revealed a two-way interaction between treatment and mean ± SEM number of c-Fos cells in the shell and core of the nucleus accumbens (treatment times shell–core;F(2,24) = 4.243; p< 0.026). A one-way ANOVA probing this interaction found significant main effects of the treatment groups only in the nucleus accumbens core (F(2,24) = 7.341; p< 0.003) and not in the shell of the accumbens (F(2,24) = 1.271; p> 0.1). Different letters indicate significant differences between groups.

