Fig. 8.

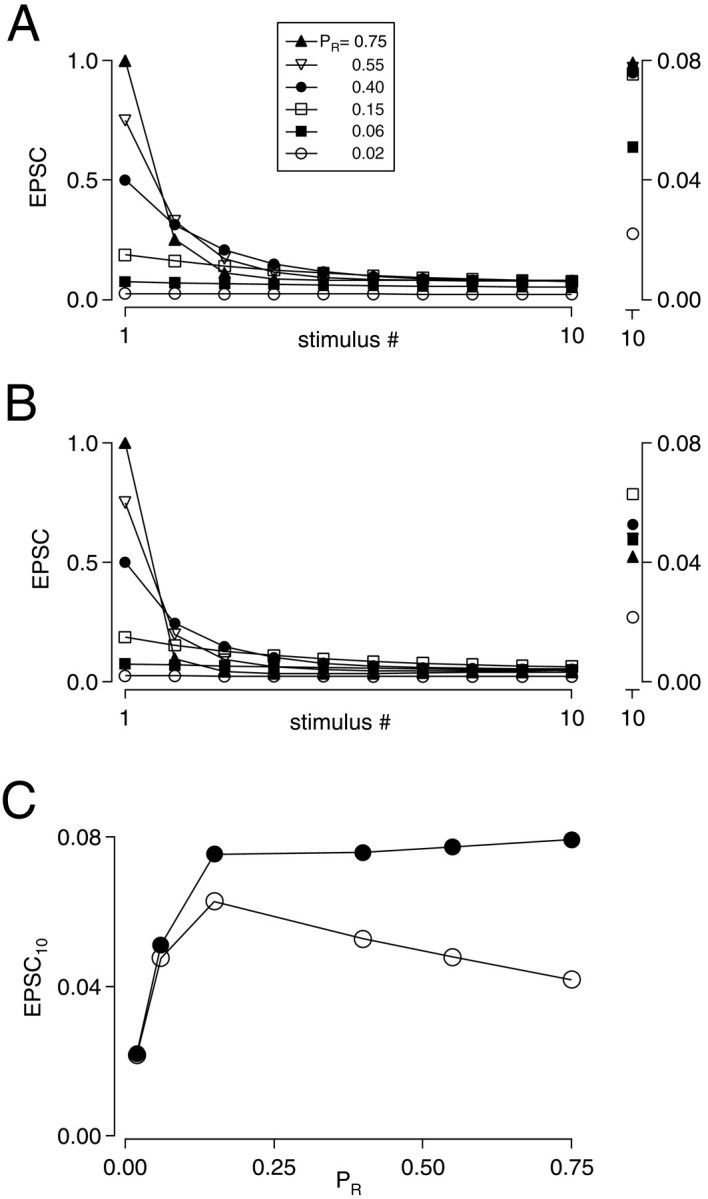
Depletion and desensitization model of synaptic depression. A, Simulations based on a presynaptic depletion model that does not include receptor desensitization. Trains of 10 stimuli at 200 Hz with PR values ranging from 0.02 to 0.75. Smaller responses to stimulus #1 correspond to lower PR values. Time constant of recovery from depression was 100 msec. EPSCs reached similar steady-state values when PR ranged from 0.15 to 0.75. Inset on right shows the 10th response on an expanded vertical scale. Note that data points are superimposed from trains withPR of 0.15 to 0.75. Y values (normalized to EPSC1) for these four data points ranged from 0.075 to 0.079. B, Desensitization was included in the model as described in Materials and Methods. PR was varied as inA. Steady-state EPSCs were maximal atPR = 0.15. Inset shows 10th response on an expanded vertical scale. C, EPSCSS is plotted versus EPSC1. Results of the presynaptic model are shown by filled circles; results of simulations incorporating postsynaptic desensitization are shown with open circles.
