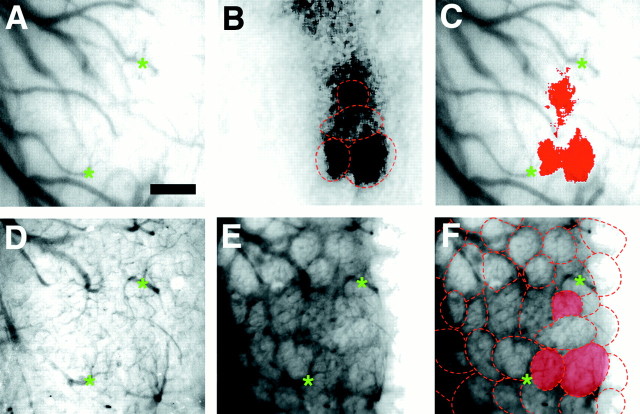
Fig. 1.
Discrete activated regions visualized with intrinsic signal imaging correspond to anatomical glomeruli.A, Blood vessel pattern overlying the imaged region visualized through thinned bone. Green asterisksindicate vessel landmarks. B, Olfactory map evoked by 1% propanal produced several active regions. Superimposed on the optical image are outlines of the glomerular pattern derived from F. The strongly activated regions are almost entirely confined to the anatomical borders of the glomeruli.C, Activity map from B thresholded at 2 SDs, pseudocolored, and superimposed on the blood vessel pattern from A. Three distinct active regions the size and shape of anatomical glomeruli are strongly activated.D, Blood vessel pattern of imaged area used for subsequent alignment after removal of bone and dura; many of the same blood vessels are readily visible. E, Glomeruli revealed by vital dye staining with the voltage-sensitive dye RH414 and observed with epifluorescence microscopy. F,Outlines of individual glomeruli from E; the three activated glomeruli seen in B andC are highlighted. Scale bar, 200 μm.

