
Fig. 7.
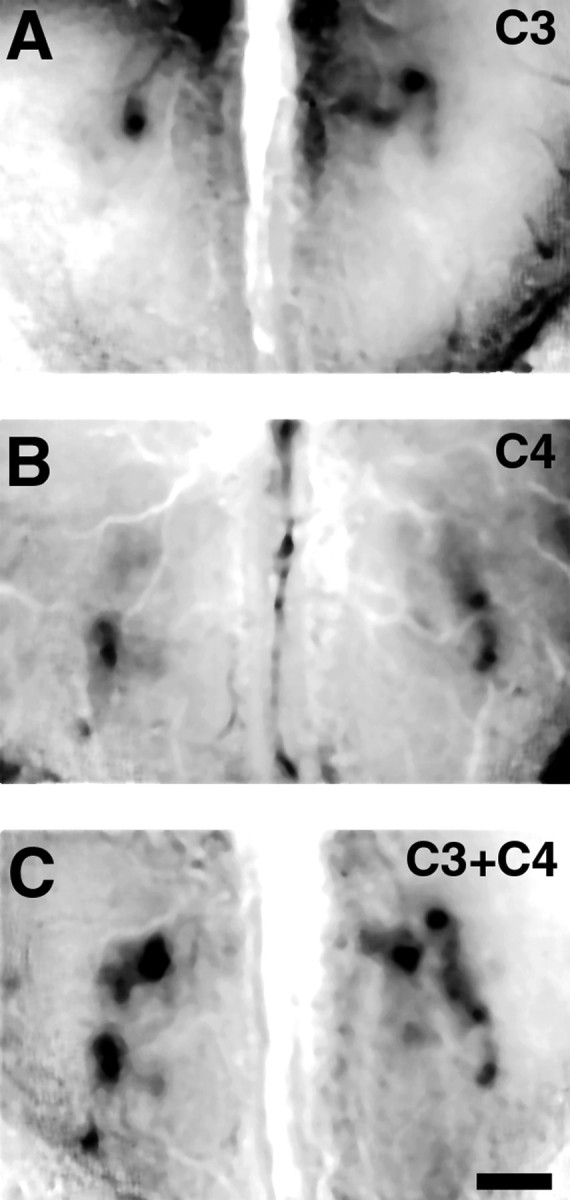
Representation of simple binary mixtures.A, Propanal (1%) activates two discrete glomeruli on the right bulb and one on the left. An additional activated region is visible in the rostral region of theright bulb. B, Optical map of odorant response to 1% butanal reveals two active peaks in each bulb located in a more rostral–lateral region, with some residual activity detected more caudally. C, Optical map of the olfactory bulb response to an equal mixture of 1% propanal and 1% butanal reveals an additive pattern of activity. Each of the features detected within the individual odorant maps (A andB) are represented within the mixture map. Regions of lower activity also appear to be additive, suggesting that they represent specific lower level activity and not nonspecific background. Maps were collected sequentially from the same mouse. Caudal is toward the top of the images. Scale bar, 500 μm.