
Fig. 1.
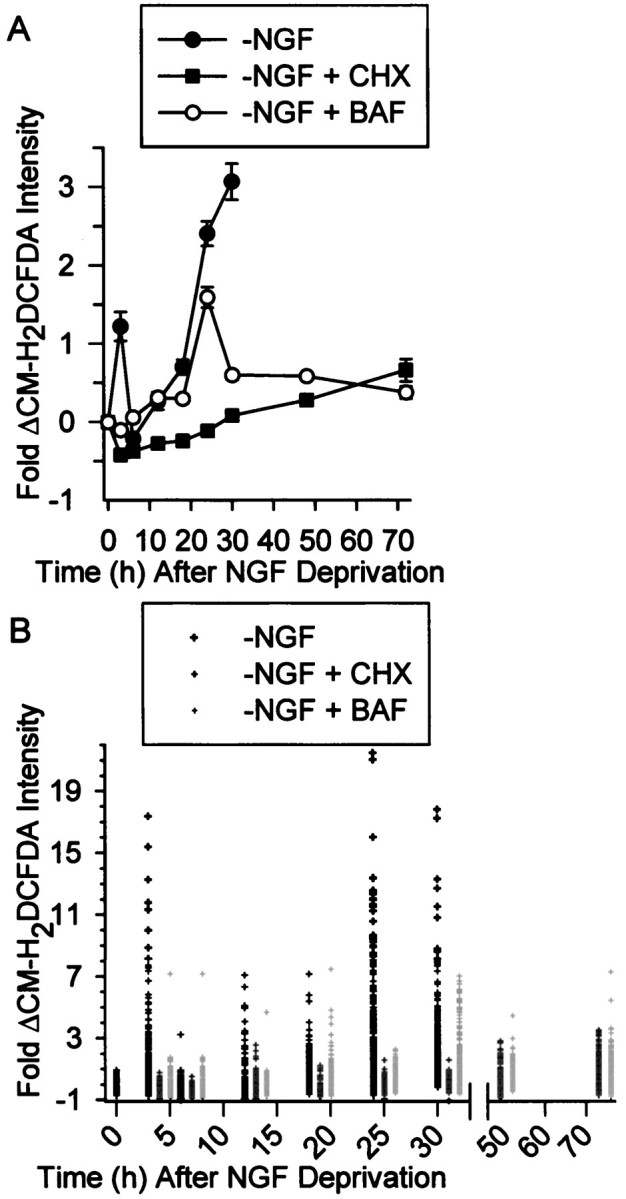
Increased Ros levels in NGF-deprived rat sympathetic neurons in cell culture. A, Average ROS levels, as measured by fluorescence intensity of the redox-sensitive dye CM-H2 DCFDA, showed a transient early increase after NGF deprivation followed by a later sustained increase. The protein synthesis inhibitor CHX (1 μg/ml), blocked both the early and delayed ROS bursts, whereas the pan-caspase inhibitor BAF (30 μm) completely blocked the early burst but only attenuated the later one. Data are shown as fold change from control values. B,Single-cell CM-H2 DCFDA values used for the averages inA. The data from the NGF-deprived cells is above the time point, and the CHX and BAF values for that time point are to the right of these values. There is no data shown for NGF-deprived cultures later than 30 hr after withdrawal because most cells had died by that time. The values shown are from cells that appeared intact when observed by phase-contrast microscopy. Except for the 24 hr time point for NGF deprivation, n = 93–290 neurons taken from three or four separate platings for the different conditions and time points. n = 383 neurons from six separate platings for the 24 hr NGF-withdrawal time point. Control CM-H2DCFDA intensity and intensity at T0 was that of cells maintained continuously in the presence of NGF. For each cell, CM-H2 DCFDA intensity was normalized (as a percentage) to the average CM-H2 DCFDA intensity of cells measured in sibling NGF-maintained cultures at the same time. Fold change from the average was then obtained for each cell by subtracting 100 from this and then dividing by 100 ([%CM-H2 DCFDA intensity − 100%]/100%). For example, the increase at 3 hr after NGF deprivation was ∼222% of control. This technique was used in all subsequent figures. Error bars for fold change are SEM in this and subsequent figures.