
Fig. 1.
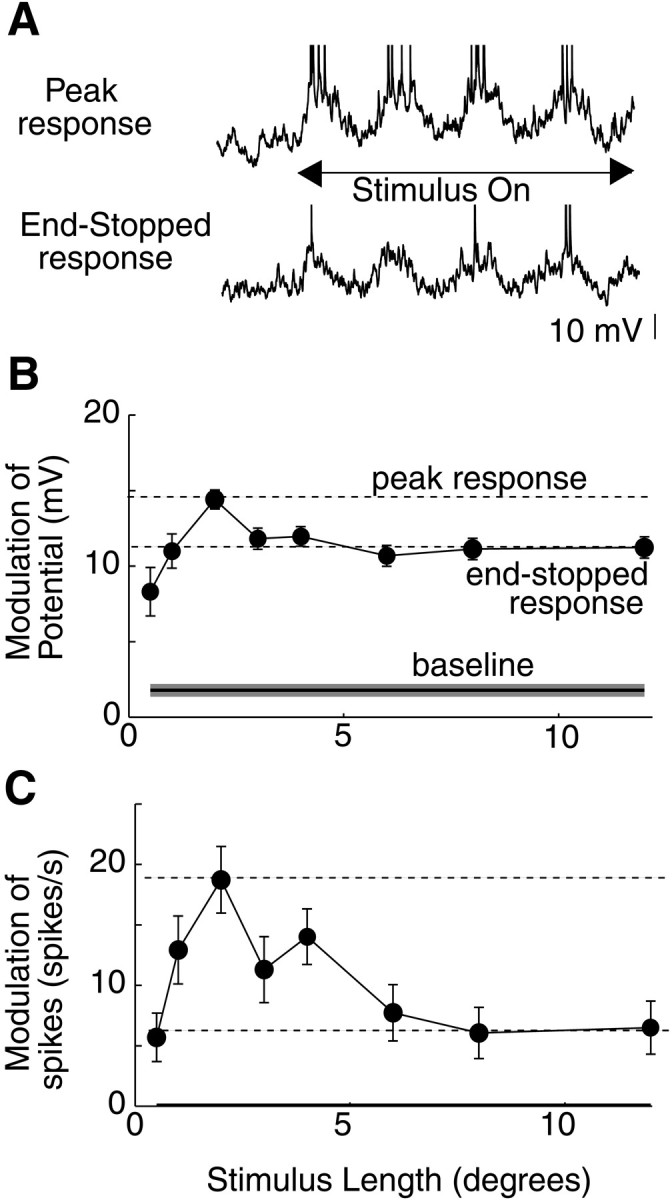
Length tuning of membrane potential and spikes in a simple cell. A, Membrane potential responses to a 2 sec drifting grating stimulus of 2° length (top) and 12 ° length (bottom). Traces show 0.5 sec before stimulus is presented. B, Peak-to-peak modulation of the membrane potential response as a function of length.Solid horizontal line shows modulation in the absence of a visual stimulus. Dashed horizontal lines show maximal (peak response) and end-stopped responses. End-stopped responses are calculated by finding the minimal response for stimuli longer than the length of the peak response. The end-stopped response is then taken as the mean of all responses of stimuli longer than or equal to the stimulus length of this minimal response. Error bars for data points and the shaded area around baseline show ±SEM across stimulus trials. C, Modulation of spikes as a function of length.