
Fig. 2.
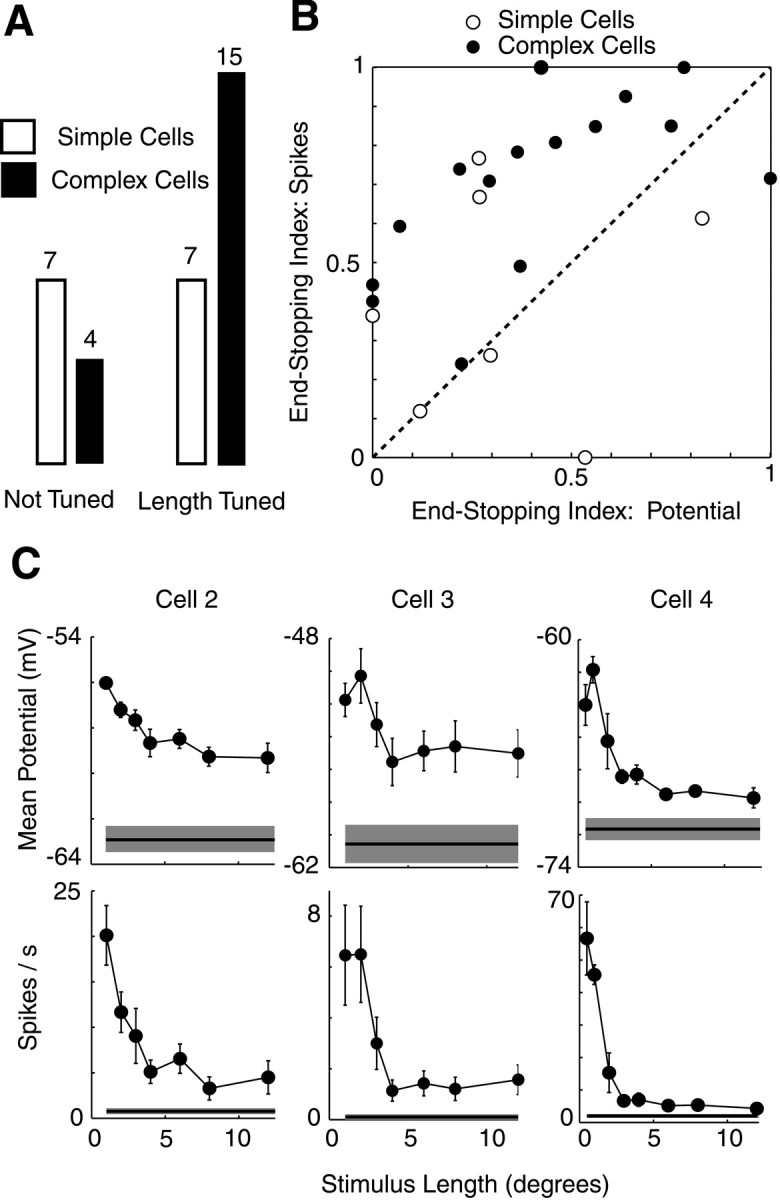
Length tuning for membrane potential and spikes in 33 cells. A, Proportion of simple and complex cells exhibiting length tuning (ESI > 0.1 for potential or spikes).B, Comparison of length tuning as measured by membrane potential and spike responses. Mean membrane potential responses are shown for complex cells and modulation of membrane potential for simple cells. C, Length-tuning curves for membrane potential and spikes for three complex cells. Error bars and shaded regions around baseline show ±SEM.