
Fig. 4.
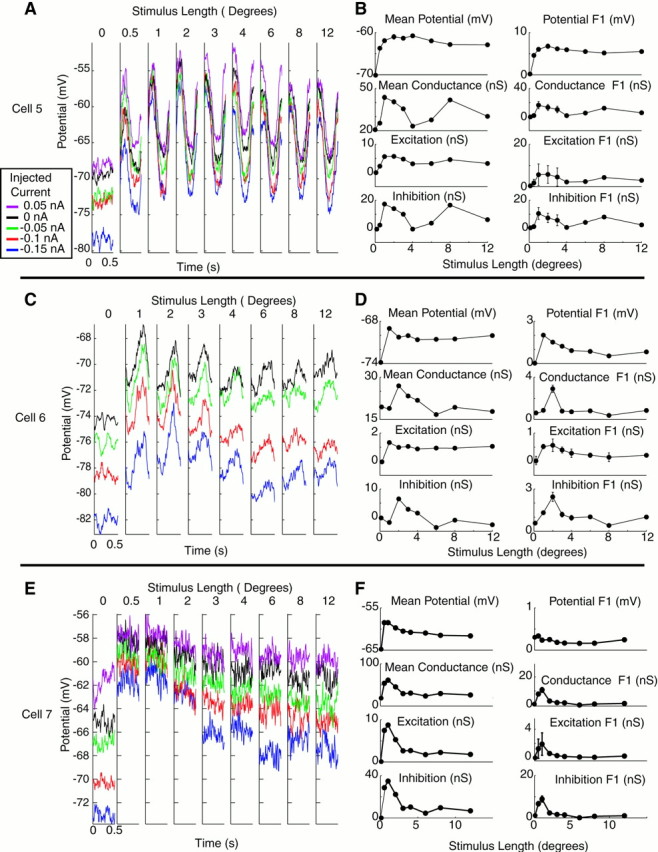
Measurement of conductance as a function of length for three end-inhibited cells. A, C,E, Average membrane potential responses with injected currents as a function of length for three cells. Eachtrace is color-coded for injected current level (seeinset legend) and represents one cycle of the drifting grating stimulus. Length of 0 indicates a blank stimulus.B, D, F, Length-tuning curves for mean and modulation of membrane potential, input conductance, and excitatory and inhibitory components of changes in input conductance. For potential, error bars show ±SEM across stimulus trials. For conductance measurements, error bars show ±SEM across conductance measurements taken from different subsets of the data (see Materials and Methods). Modulation represents peak-to-peak modulation of each parameter (2 * F1).