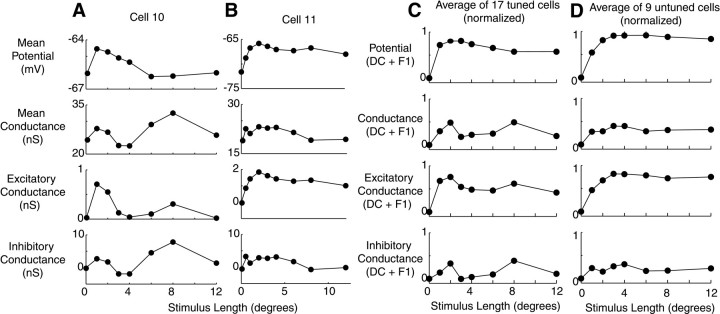
Fig. 6.
Length tuning of membrane potential and input conductance in 26 cells. A, B, Mean potential, conductance, and excitatory and inhibitory components of conductance for two complex cells. Format is identical to Figure4B. Error bars for both cells are almost entirely covered by data points. C, Average potential and conductance responses in a population of 17 cells showing length tuning. In each cell, the mean and modulation responses are added for each of the four graphs and normalized to have peak 1 and baseline 0. Normalized traces for each of the four graphs were then averaged for all 17 cells. Error bars corresponding to SEM for cells are covered by data points.D, Average potential and conductance responses in a population of nine cells not showing length tuning. Error bars corresponding to SEM for cells are covered by data points.

