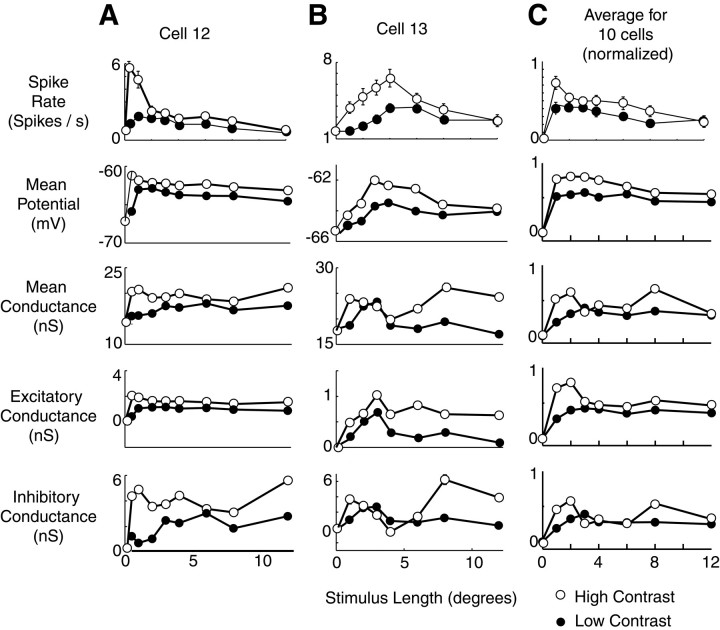
Fig. 7.
Effect of stimulus contrast on length tuning of membrane potential and conductance. A, B, Mean potential, conductance, and excitatory and inhibitory components of conductance for two complex cells at high (open circles) and low (filled circles) contrast. Format is identical to Figure 4B, except that two contrast levels are shown. For both cells, high contrast was 64%, and low contrast was 16%. C, Average potential and conductance responses at high and low contrast in a population of 10 cells. Mean spike rate, membrane potential, input conductance, and excitatory and inhibitory components of conductance are shown. Traces were first normalized for each cell as in Figure 5 and then averaged across cells. High contrast among the cells ranged from 30 to 64%, and low contrast ranged from 8 to 16%.

