
Fig. 1.
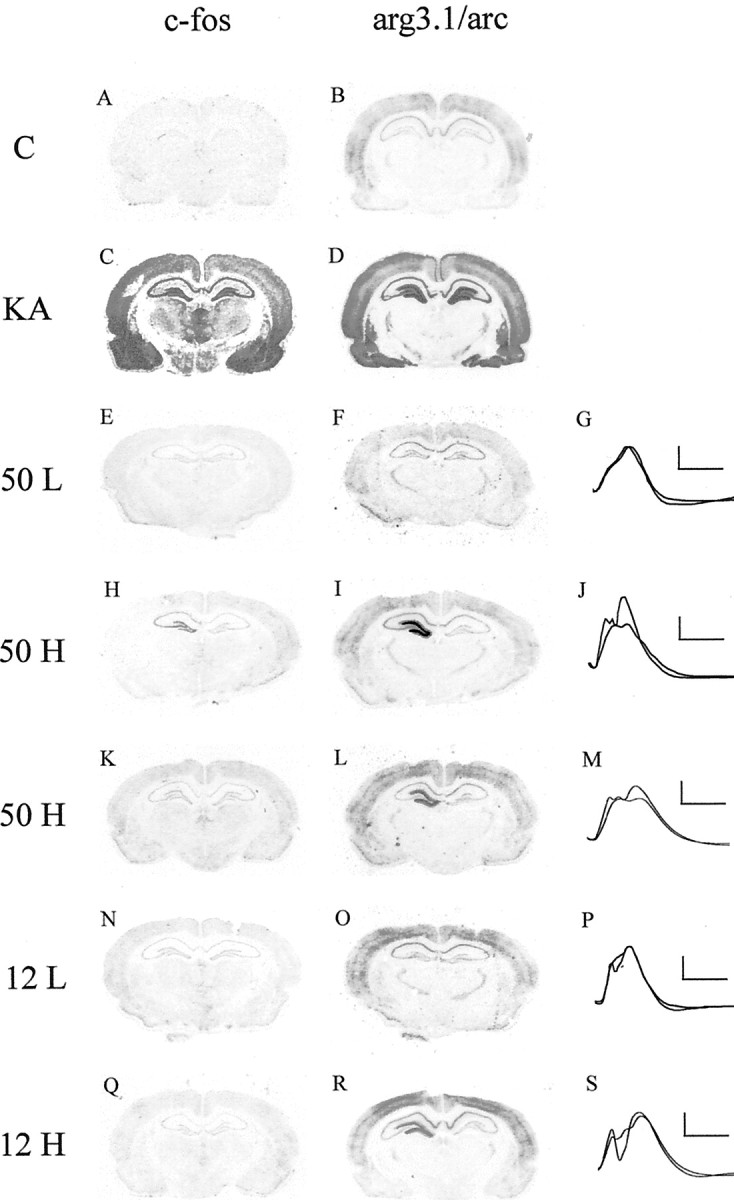
Comparison of arg3.1/arc and c-fosmRNA levels after kainic acid-induced seizures and LTP-producing stimulation. Coronal sections were assayed for arg3.1/arc and c-fos mRNA using in situ hybridization with antisense RNA probes. Representative autoradiographs of three independent experiments are shown. A, B, One hour after saline injection. C, D, One hour after kainic acid (10 mg/kg)-induced seizures.E, F, One hour after 50-train LFS of the perforant path in freely moving rats. H,I, K, L, One hour after 50-train HFS (n = 5). N, O, One hour after 12-train LFS. Q, R, One hour after 12-train HFS. G, J,M, P, S, Superimposed field potentials before and 1 hr after LFS or HFS, respectively. Calibration: 5 mV, 5 msec.