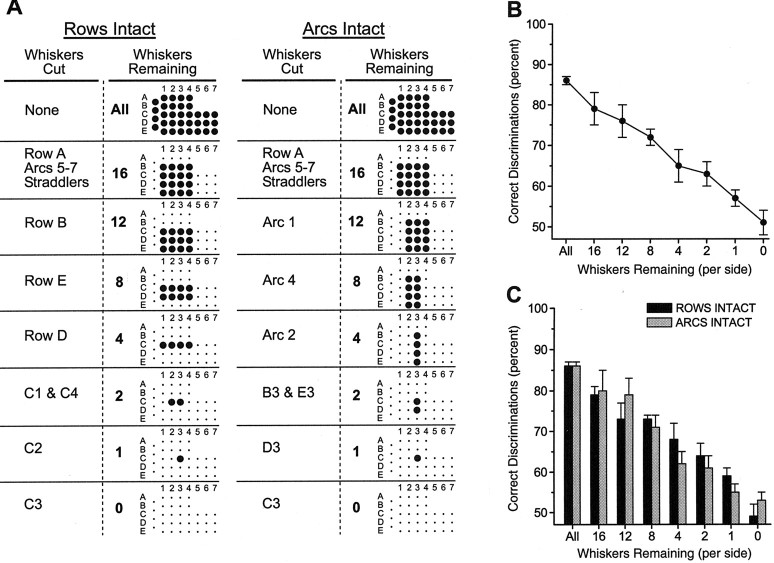
Fig. 5.
A, Graphical depiction of the whiskers removed at each stage of the experiment. The leftmost two columns refer to the ROWS INTACT group, and therightmost two columns refer to the ARCS INTACT group. The Whiskers Cut columns describe which whiskers were cut at each stage. The Whiskers Remaining columns show how many total whiskers were remaining and a depiction of which whiskers. Each grid represents the vibrissal array.Large dots represent intact whiskers; small dots are cut whiskers. Thus, after the first set of whisker cuts, a grid of 16 intact whiskers remained (Rows B–E, Arcs 1–4). Subsequent cuts further reduced the total number of intact whiskers. As seen in each group, different sets of whiskers were removed at each step. B, Mean (±SEM) percentage of correct discriminations for all rats (n = 8) in which whiskers were systematically removed. There is a gradual decrease in performance that is correlated with the total number of whiskers removed. Each data point represents the mean percentage of correct discriminations of all three training sessions for both groups of rats (ROWS INTACT and ARCS INTACT) after each set of whisker cuts.C, Discrimination performance for each separate group of rats in which different sets of whiskers were cut. There is no difference between groups, indicating that different whiskers in the vibrissal array are functionally equivalent.

