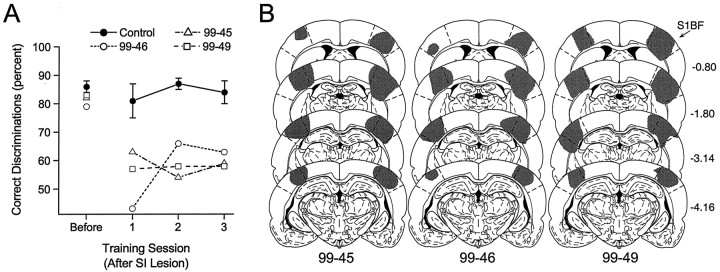
Fig. 7.
A, Mean (±SEM) percentage of correct discriminations in the session before aspiration of the barrel region of the SI cortex (Before) and for the three sessions (1–3) after cortical lesions for each of the rats with SI lesions (n = 3; open symbols). Cortical lesions significantly impaired the ability of the rats to perform the discrimination. The performance of control rats (n = 3; Control) did not differ before or after surgery. B, Extent of the cortical lesions (gray regions, shown on standard sections) for each cortically lesioned rat. Numerals on the right represent the distance (millimeters) of each section posterior from the bregma skull suture. Regions demarcated bydashed lines represent the barrel region of the primary SI cortex. Atlas templates are modified from Paxinos and Watson (1986).S1BF, Barrel region of the SI cortex.Numerals below each column identify individual rats.

