
Fig. 3.
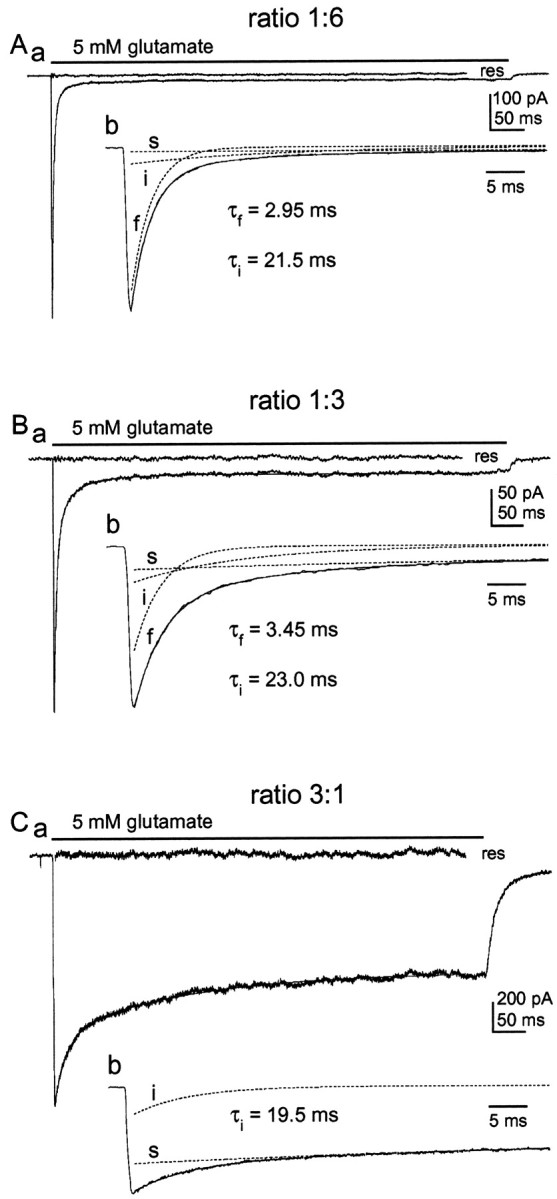
The relative amplitudes of the fast, intermediate, and slow components of decay vary systematically with the ratio of wild-type and mutant cDNAs. Aa, Glutamate-evoked current in a patch from a cell cotransfected with plasmids encoding GluR1flip (L497Y) and GluR1flip at a cDNA ratio of 1:6. The decay of the current was fitted with two exponential components and a small sustained current. The fit (smooth solid line) and the residual current (res) are shown. Ab, Same trace as in Aa on an enlarged time scale together with the three individual components (dotted lines). The values for τf and τi are given. B, Same as A, except that the cell from which the patch was excised was cotransfected with GluR1flip (L497Y) and GluR1flip cDNAs at a ratio of 1:3. C, Same as A, except that the transfection mixture contained GluR1flip (L497Y) and GluR1flip cDNAs at a ratio of 3:1. Note that there is no fast component of decay. The time constants obtained for the fast and intermediate components are given in each panel.