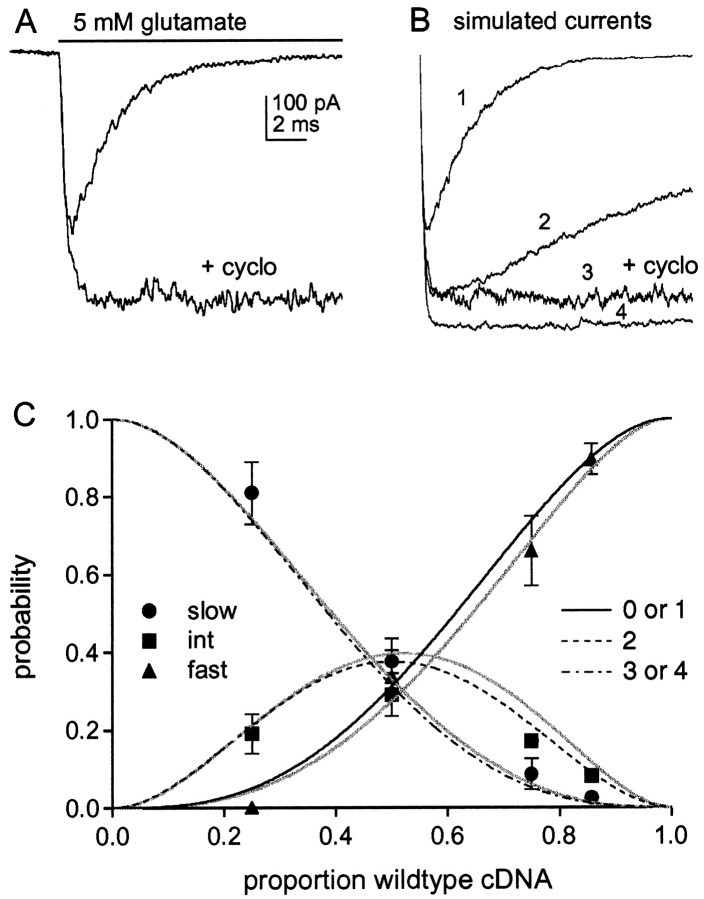
Fig. 5.
The effect of cyclothiazide and comparison of the results with combinatorial predictions. A, Currents evoked by 5 mm glutamate in a patch from a cell transected with wild-type GluR1flip. Preexposure of the patch to cyclothiazide (100 μm) greatly slows desensitization and potentiates the peak current amplitude. B, Simulated currents generated with the model shown in Figure6D in response to a sustained application of 5 mm glutamate. The number of channels was set to 1000 for each simulation. The analysis was performed to estimate the extent to which the peak current amplitude underestimated the number of channels as the result of some channels desensitizing without ever opening. The trace labeled 1 mimics the kinetics of wild-type GluR1flip homomers. The following values were used for the rate constants: k1 = 1 × 10⁷ M−1s−1,k-1 = 7000 s−1, β4 = 7000 s−1, α4= 2550 s−1, δ4 = 2000 s−1, γ4 = 1 s−1. These values reproduced the rise time (10–90% = 180 μsec), desensitization (τ = 2.2 msec, 0.25% plateau current), and deactivation kinetics (τdeact = 0.7 msec) (Fig. 6C) of wild-type channels and gave an EC50 value of ∼800 μm. The results were largely insensitive to the values of the other rate constants. The β and α values for partially liganded states were set to the corresponding values for the fully liganded state. The conductance of the open states with one, two, and three agonist molecules bound were taken to be 0.25, 0.5, and 0.75 of the value of the fully liganded state. It was assumed that glutamate bound with 100-fold higher affinity to desensitized channel states (k1 =k2,k−2 = 70 s−1), and the δ and γ values for partially liganded states were set to maintain microscopic reversibility. The trace labeled 3 was obtained with δ4 = 1 s−1and mimics the effect of cyclothiazide on wild-type channels. The trace labeled 2 mimics the decay of the intermediate component (τ = 20 msec) and was obtained by setting α4= 400 s−1 and δ4 = 1400 s−1. The trace labeled4 mimics the decay of the slow component (τ = 100 msec, 90% plateau current) and was obtained by setting α4 = 200 s−1, δ4 = 80 s−1, and γ4 = 15 s−1. These values gave a τdeact of 9 msec, which is similar to the value measured for homomeric mutant channels (Fig. 6C). Note that the peak wild-type and intermediate currents (traces 1 and2) reach only 65 and 88% of the amplitude of the slow component (trace 4), although the number of channels was set to 1000 for each simulation. C, The relative amplitudes of the three components fast (▴), intermediate (▪), and slow (●), at the four cDNA ratios tested. Eachpoint is the mean value from measurements made in five to seven patches. The bars indicate the SD, some of which were less than half the symbol height. Theblack curves show the summed probability of homomeric GluR1flip channels and channels with one GluR1flip (L497Y) subunit (solid line), the probability that channels will contain two GluR1flip(L497Y) subunits (dotted line), and the summed probability of having homomeric GluR1flip (L497Y) and channels with one wild-type GluR1flip subunit (dashed line). The probabilities are plotted as a function of the proportion of wild-type subunits present, assuming that the subunit assemblies are tetramers. The gray curvesshow the corresponding probabilities after adjusting the results for the fast and intermediate components (for missing channels that never open) using the relative amplitudes of the peak currents predicted from the simulated results in B (fast and intermediate components underestimated by 35 and 12%, respectively, relative to the slow component).

