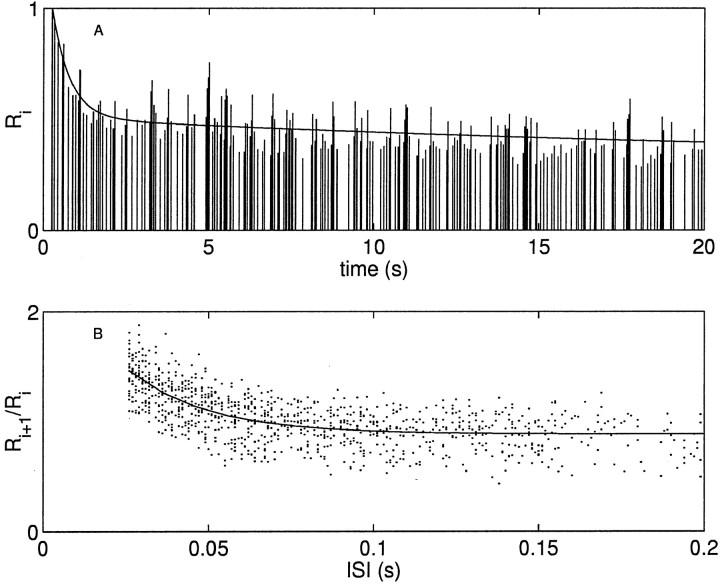
Fig. 4.
Postsynaptic response shows two rate constants of depression and one of facilitation. A, The IPSCs (sticks) recorded in a postsynaptic neuron in response to stimulating the presynaptic interneuron B4/5 with a 10 Hz exponentially distributed train of impulses. There are two time scales of depression, one rapidly and the other slowly depressing. Solid line is the best fit to a double exponential function with rate constants 0.03 and 1.81 s−1. The data are normalized by the amplitude of the first IPSC. B, The ratio of the amplitude of an IPSC to that preceding it (dots) plotted as a function of interspike interval. Data are from the entire 120 sec stimulus train of which the first 20 sec are plotted above. Solid line is the best fit to a single exponential function with a rate constant of 43.5 s−1.

