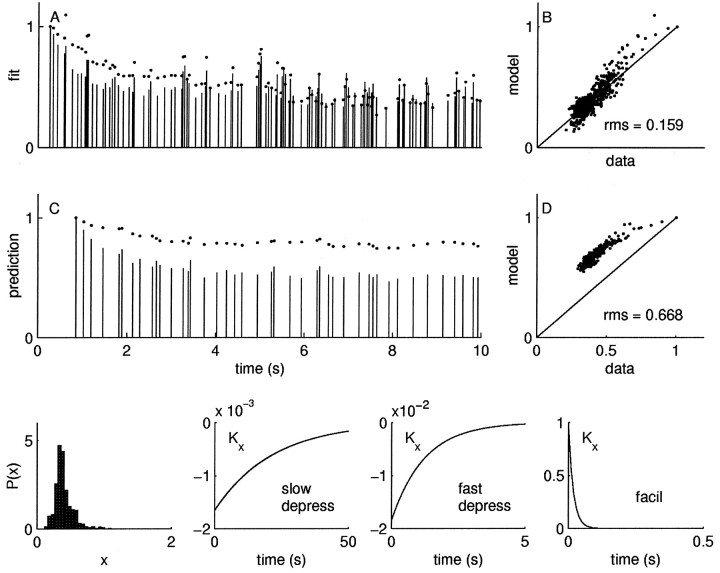
Fig. 5.
Linear model. IPSC amplitudes are proportional to the convolution of the spike train with a linear response function Kx, which is the sum of three exponential processes: rapid depression, slow depression, and facilitation. The fit is a reasonable first-order approximation with an rms error of 0.15. This is approximately twice as high as the intrinsic variability. A, The vertical sticks are the IPSC magnitudes in the first 10 sec of presynaptic stimulation with 10 Hz train of exponentially distributed impulses; the dots are the best fit of the linear model. B, Data versus model for the entire 60 sec modeled segment. C, D, When the model fit to the data in A and B is used to predict the responses to a novel random stimulus from a different statistical distribution with a different mean frequency (5 Hz train of uniformly distributed intervals), the error is dramatically worse. Bottom panels, The density of the underlying component x and the exponential functions that contribute to kernel Kx: slow depression, rapid depression, and facilitation. The data are normalized by the amplitude of the first IPSC.

