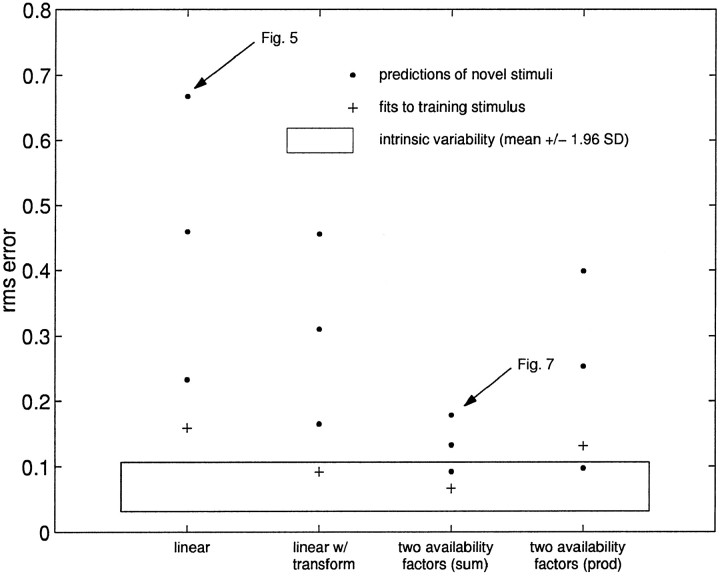
Fig. 6.
Model fits and prediction of novel stimuli for four classes of models. Because the data clearly show three time scales of short-term changes in synaptic efficacy (Fig. 4), we looked at several ways in which these time scales can enter into the model presented in Equation 6. Each of the models presented was trained on the same stimulus, a 10 Hz exponential train (+). This model was then used to predict the responses to novel stimuli (●), which were spike trains with different means and interval distributions. Thebounding box shows the range of the intrinsic variability (mean ± 1.96 SD) of the neuron in response to identical stimuli. Although several models provide good fits to the data, the two additive availability factors model is significantly better at predicting responses to novel stimuli. An example of the data for the worst case (linear model) and best case (two additive factors model) is shown in Figures 5 and 7. The number of parameters for the four models shown are 5 (linear), 7 (linear w/transform), and 6 (two factors additive or multiplicative).

