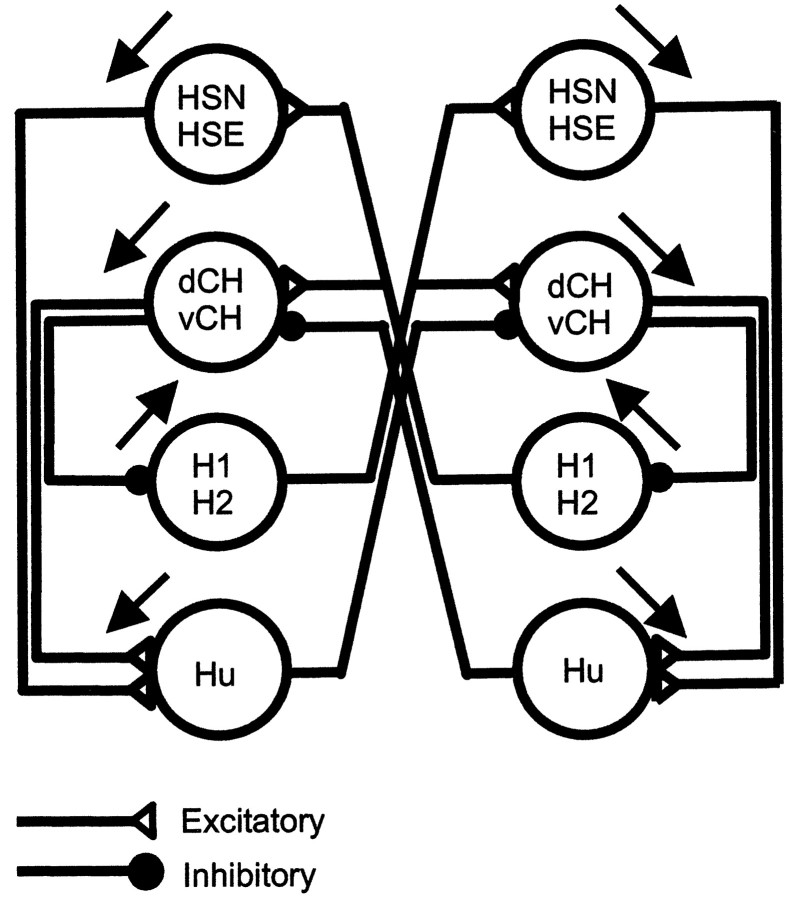
Fig. 1.
Summary diagram about the connections between large-field lobula plate neurons characterized in this study. Excitatory connections are shown as open triangles; inhibitory connections are shown as filled circles.Black arrows indicate the preferred direction of visual motion on the ipsilateral side of the cells.

