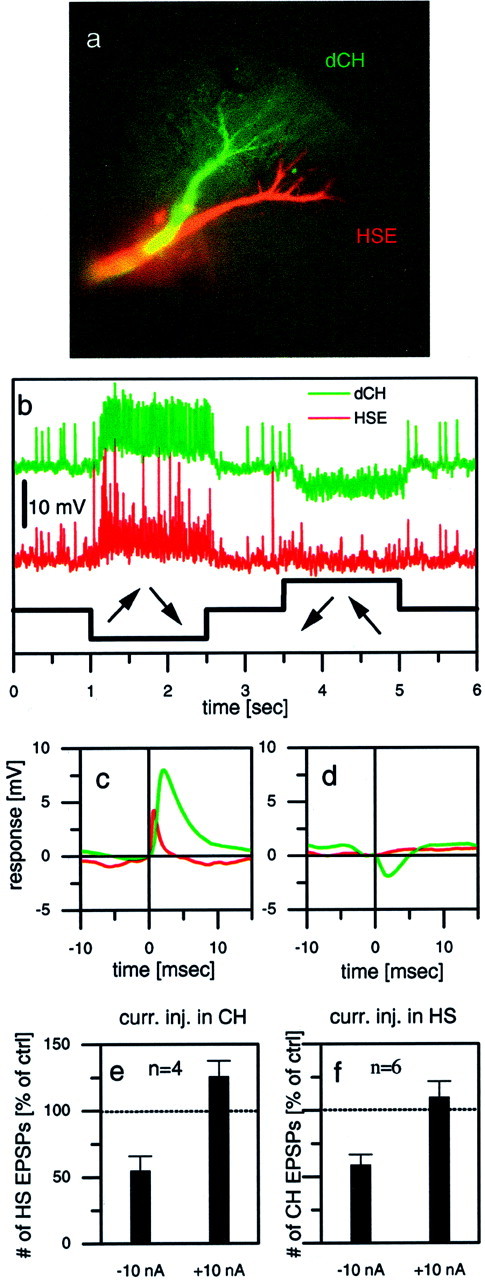
Fig. 6.

Dual intracellular recording of two LPTCs in the same brain hemisphere. a–e, Example responses from a dCH–HSE pair. a, Fluorescent micrograph of both cells, one filled with Ca-green and the other with Alexa 568 (both from Molecular Probes). b, Visual responses of both cells to a rotatory motion stimuli in front of the fly. Because both cells have the same preferred direction, they jointly respond to motion in one direction with a depolarization and in the other direction with a hyperpolarization. c, Averaged HSE signals (red) triggered by large-amplitude EPSPs in the dCH cell (green). d, Averaged HSE signals (red) triggered by IPSPs in the dCH cell (green). e, Average effect (mean ± SEM) of current injection into CH cells on the EPSP frequency observed in HS cells. Hyperpolar- ization of CH cells led to a decreased EPSP frequency in HS cells, whereas depolarization led to only a small increase in EPSP frequency. Data are from four experiments comprising the following cell pairs: dCH–HSN (n = 1), vCH–HSE (n = 1), and dCH–HSE (n = 2). f, Average effect (mean ± SEM) of current injection into HS cells on the EPSP frequency observed in CH cells. Hyperpolarization of HS cells led to a decreased EPSP frequency in CH cells, whereas depolarization led to an EPSP frequency that was almost unchanged. Data are from six experiments comprising the following cell pairs: dCH–HSN (n = 2), vCH–HSN (n = 2), and dCH–HSE (n = 2).
