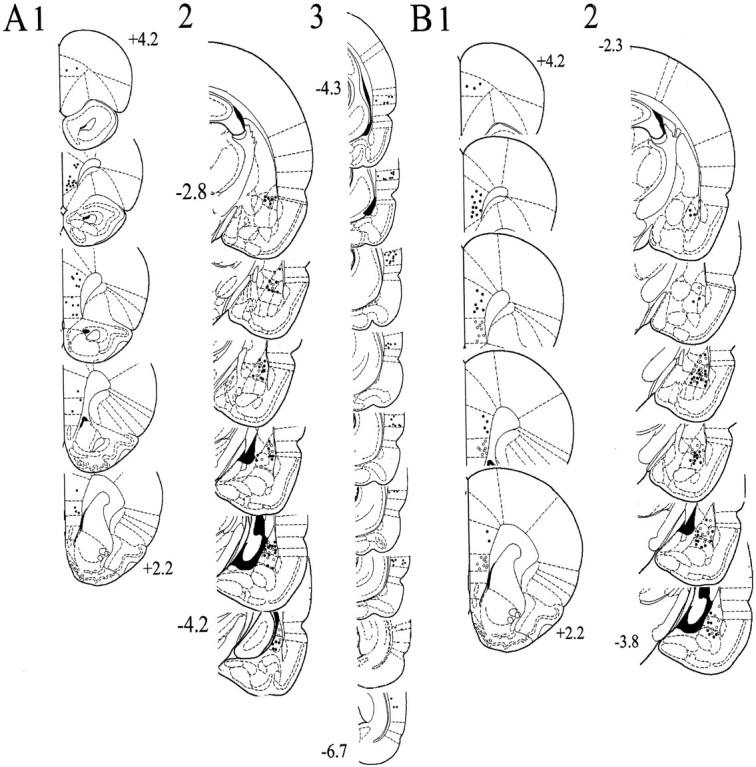
Fig. 3.

Placement of stimulating and recording electrodes.A, Stimulating electrode placements in the Te3 (3; −4.3 to −6.7 mm bregma) that evoked short-latency responses in the BLA (2; black andwhite circles, −2.8 to −4.2 mm bregma), and mPFC stimulation sites (1; +4.2–2.2 mm bregma) that suppressed Te3-evoked responses (2; white circles). B, Stimulating electrode placements in the infralimbic (gray circles) and prelimbic (black circles) cortex subdivisions of the mPFC (1; +4.2–2.2 mm bregma) that evoked short-latency responses in the BLA (2; white circles indicate infralimbic cortex-evoked responses, and black circles indicate prelimbic cortex-evoked responses, −2.3 to −3.8 mm bregma). This figure included only those neurons used for analysis in this study.
