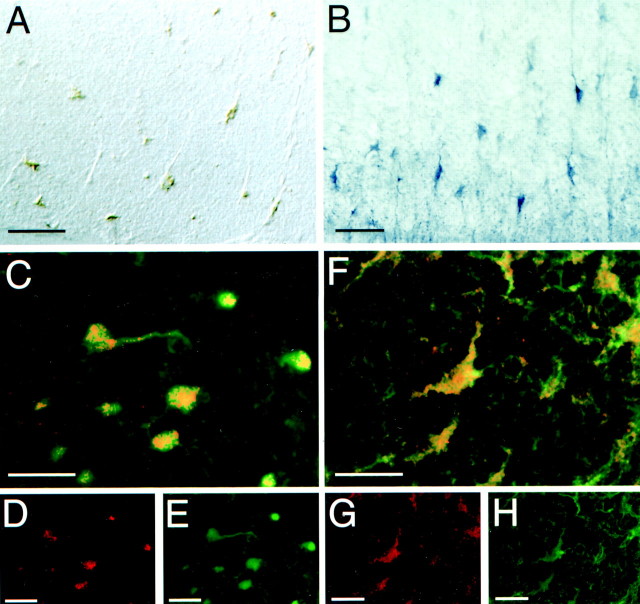
Fig. 5.
Oligodendroctyes express netrin-1 in the adult spinal cord. A, In situ hybridization showing the distribution of netrin-1-expressing cells in white matter at the ventral edge of the adult rat cervical spinal cord. B, Distribution of netrin immunoreactivity in a similar section of cervical spinal cord.A and B are visualized with POD and DAB.C–E, A transgenic mouse line that marks the oligodendroglial lineage by expression of lacZ used to determine the relationship between netrin-1 expression and oligodendrocytes. D, Confocal analysis of netrin-1 immunoreactivity (red, Cy3-conjugated secondary antibody). E, β-Gal immunoreactivity marking oligodendrocytes (green, FITC-conjugated secondary antibody). C, Superimposition ofD and E showing netrin-1-immunoreactive oligodendrocytes. F–H, Confocal image analysis of double-labeled immunoreactivity in the adult rat spinal cord of netrin and the oligodendrocyte marker CNP. G, Netrin-1 immunoreactivity (red, Cy3-conjugated secondary antibody). H, Distribution of CNP immunoreactivity (green, FITC-conjugated secondary antibody).A, DIC optics. B, Bright-field optics, POD-conjugated secondary antibody and DAB. C–H, Confocal microscopy. Objective magnification: A, B, 40×; C–H, 100×. Scale bars: A, B, 50 μm; C–H, 25 μm.

