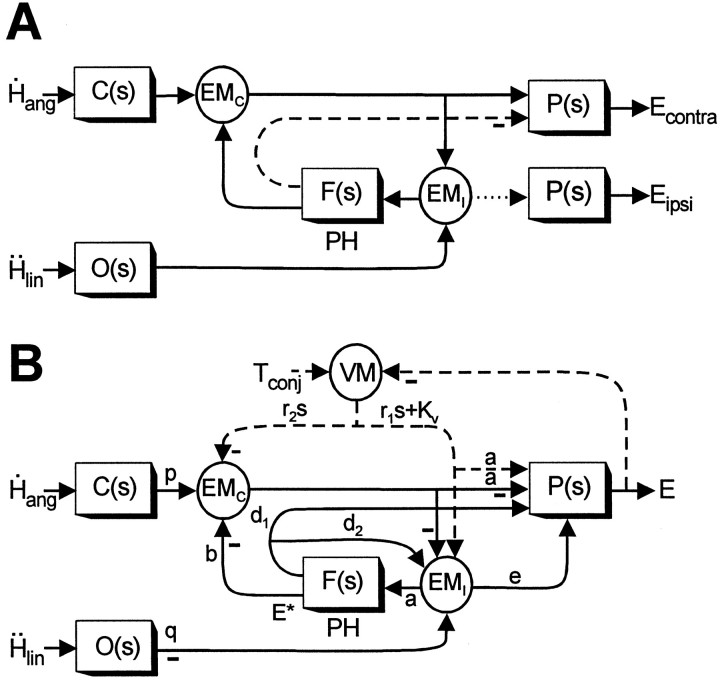
Fig. 10.
Proposed model of the VORs. A, Schematic of the feedback realization of the eye plant hypothesis (Fig.9D) (Green and Galiana, 1998) that has been extended here to include both lumped eye-ipsi (EMI)- and eye-contra (EMC)-sensitive cell types. Thedotted line indicates an assumed weak projection from EMI cells to the ipsilateral abducens to account for the disynaptic utriculo-ocular pathways (Uchino et al., 1994, 1996). Thedashed line indicates an inhibitory projection from PH neurons [i.e., at the output ofF(s)] to the contralateral abducens (McCrea and Baker, 1985; Langer et al., 1986; Escudero and Delgado-Garcia, 1988) that may account for the inhibitory polysynaptic utriculoabducens pathway (Uchino et al., 1997). B, Actual model structure based on the schematic in A that was used to examine the predicted responses of the EMC and EMI cell types under different visual-vestibular interaction conditions. Dashed pathways associated with visuomotor areas (VM) are activated by the presence of a visual target and represent a simplified lumped pursuit system (Green and Galiana, 1998, 1999; Green, 2000). Negative signs denote projections that on the basis of anatomy are presumed to be either inhibitory to the ipsilateral side of the brain or excitatory to the contralateral side of the brain. Similarly, positive projections (i.e., no negative sign) are assumed to be either excitatory to the ipsilateral side or inhibitory to the contralateral side of the brain. Because the projections in the positive feedback loop interconnecting the EMC and EMI cells are illustrated as negative (inhibitory), both cell types should be assumed to be located on the same side of the brain in interpreting model simulations. Vestibular stimulation is provided by the angular head velocityH˙ang, sensed by the semicircular canals, C(s) =Tcs/(Tcs+ 1), and linear head accelerationḦlin, sensed by the otolith organs, O(s) = 1/(Tos + 1). The negative sign at the output of O(s) indicates that afferents associated with the medial portions of the utricular maculae (excited for contralaterally directed translation) are assumed to provide the TrVOR drive.Tconj describes the conjugate target position in a head-fixed reference frame. The neural filter,F(s) =Kf/(Tfs+ 1), represents an internal model of the eye plant,P(s) =Kp/(Tps+ 1), when Tf =Tp. The output of the model,E, represents conjugate eye position. Model parameters are as follows: a = 0.19, b = 0.75, d1 = 0.21,d2 = 1.1, e = 0.03,Kp = 1,Kf = 2.81,Kv = 9.51, p = 1,q = 0.27, r1 = −0.1, r2 = 0.1,Tf = 0.25,Tp = 0.25,Tc = 5, andTo = 0.0159. Note that to simulate appropriate responses for a vergence angle of 6.4°, the primary otolith projection weight q was adjusted to produce a TrVOR gain of 1.2 cm/° at 4 Hz (equivalent to a TrVOR gain of 0.32 cm · degree−1 · MA−1). MA, Meter-angles, defined as the reciprocal of viewing distance in meters. See previous figure legends for other abbreviations.

