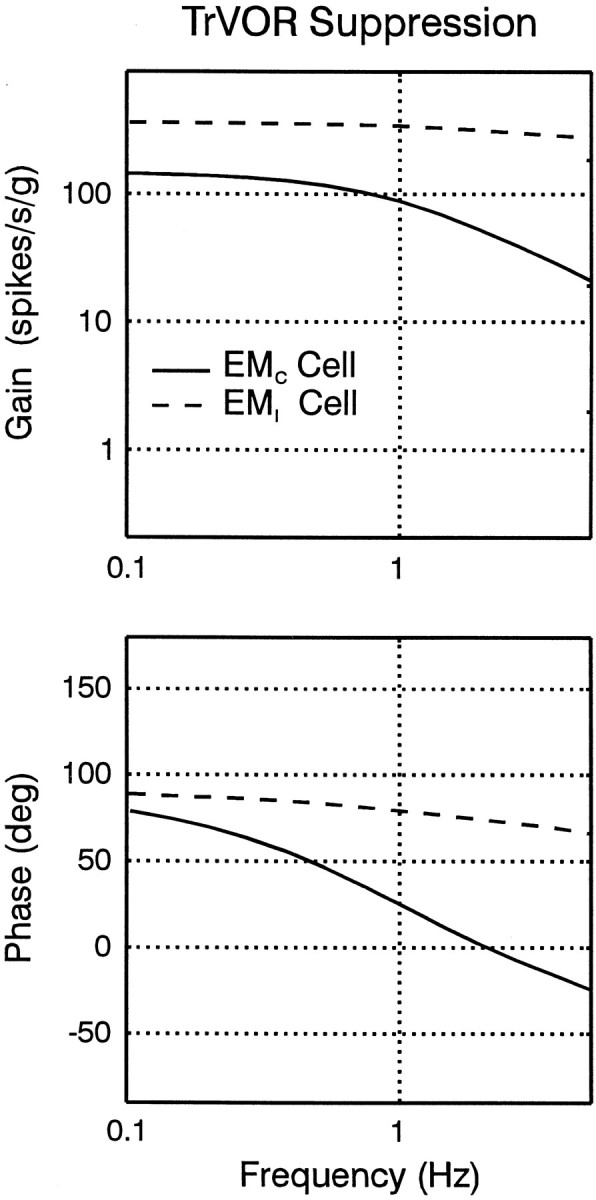
Fig. 11.

Predicted frequency response plots for the EMC and the EMI cell types (solid and dashed lines, respectively) in the model of Figure 10B during TrVOR suppression. Cell response gains are expressed relative to translational head acceleration. The response phase of the EMI cell is expressed relative to contralaterally directed head velocity, whereas the EMC cell response phase is expressed relative to ipsilaterally directed head velocity. See previous figure legends for abbreviations.
