
Fig. 1.
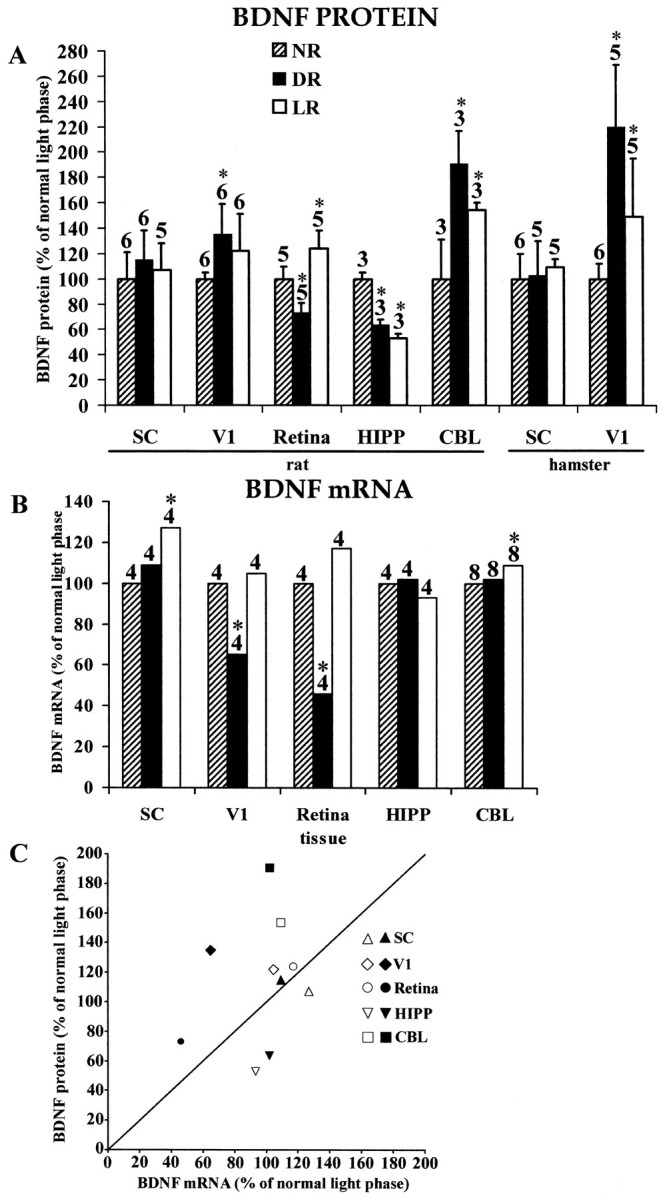
A, ECLIA measurements of BDNF protein concentrations in the SC, V1, retina, HIPP, and CBL of rats born and reared in a normal light cycle (NR; 14/10 hr light/dark cycle), constant darkness (DR), or constant light (LR). Similar measurements for SC and V1 are presented for hamsters at the right. All values are expressed as the percentage of normal. Error bars show SD. Numbers above each barindicate the number of independent samples from which data were obtained (see Materials and Methods). B, RPA measurements of BDNF mRNA concentrations in rats in the same structures and under the same rearing conditions shown in A. All values are expressed as the percentage of normal. Numbers above each bar indicate the number of independent samples from which data were obtained (see Materials and Methods). Means and SEs of PhosphorImager pixel densities are indicated in Table 1.C, Scatter plot summarizing the relationship between changes in BDNF mRNA and BDNF protein induced in rats by DR (filled symbols) and LR (open symbols). Asterisks in A and Bindicate values in LR or DR animals that differ significantly from normal.