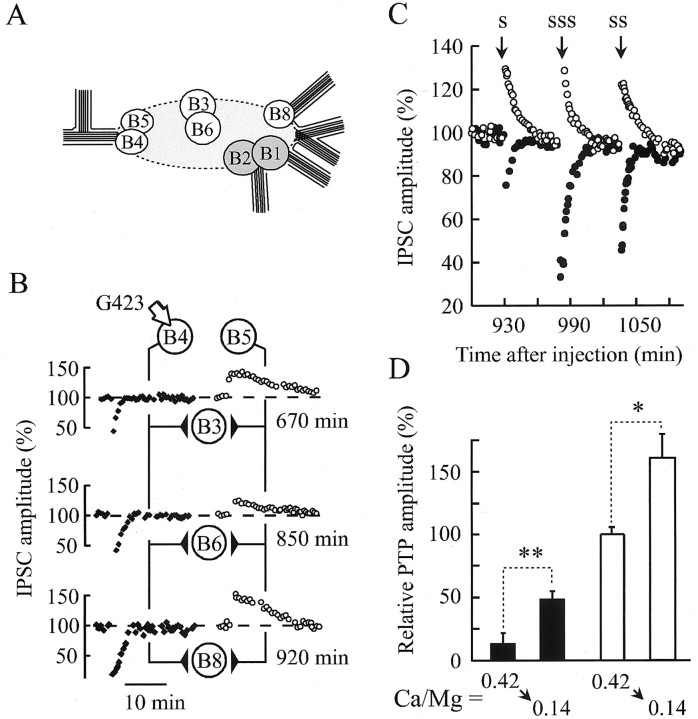
Fig. 4.
Amplitude of PTP and PTD depends on the release conditions. A, Schematic representation of the buccal ganglion of Aplysia californica.B4 and B5 denote presynaptic cholinergic neurons. B3, B6, and B8are their postsynaptic targets. B, A representative experiment of a series of three is shown. Conditioning stimuli were applied as described in Figure 3 at G423 antibody-injected (B4, arrow) and noninjected (B5) neurons. The ensuing PTDs (●) or PTPs (○) were recorded at the indicated times after the injection by impaling successively B3, B6, and B8 neurons. C, Effects of the strength of the conditioning stimulus on PTP and PTD amplitudes recorded from G423-injected (●) and noninjected (○) neurons at the indicated times after the injection. The following conditioning stimuli were applied: 1 train (1 sec at 50 Hz) (S), 4 trains (SS), 10 trains (SSS).D, The effect of anti-synapsin antibody injection on PTP amplitude depends on the release probability. Relative PTP amplitudes were determined as a percentage of the mean PTP amplitude recorded before the injection as described in Figure 3C. PTP amplitudes were determined from antibody-injected (G423,n = 2; G177, n = 1;filled bars) and noninjected (n = 3;open bars) neurons 460–515 min after antibodies were injected. Then, a low Ca2+-containing medium (Ca/Mg ratio = 0.14) was substituted for the high Ca2+medium (Ca/Mg ratio = 0.42), and the relative PTP amplitudes were determined (i.e., 520–550 min after antibody injection). *p < 0.05, **p < 0.01; Student's unpaired t test.

