Fig. 7.
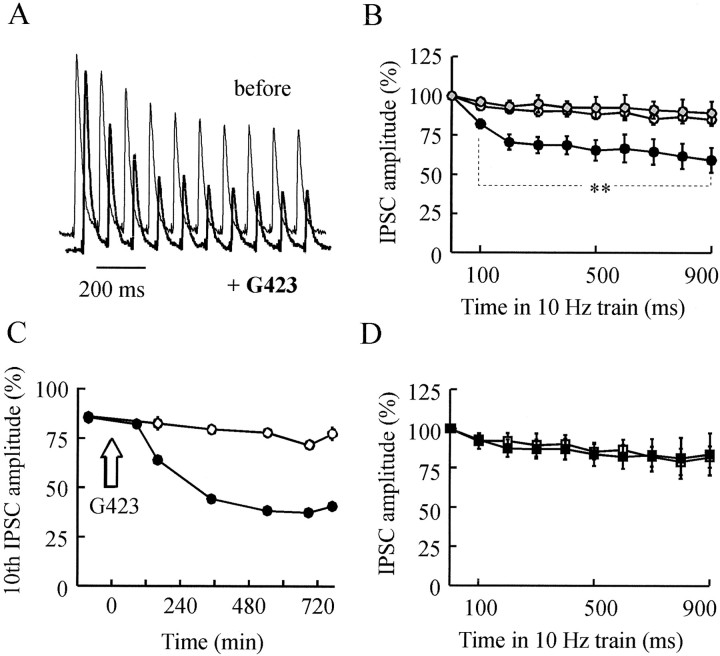
Frequency stimulation-induced depression (10 Hz) is increased after synapsin neutralization. Representative postsynaptic responses evoked by 10 Hz (A) stimulation applied before (thin line) or 485 min after (thick line) G423 injection. B, The mean amplitude of the 10 IPSC responses evoked by the 10 Hz train 430–530 min after injection of antibodies was determined (see Materials and Methods) and normalized against the corresponding values determined before injection. Mean values (±SEM) were calculated after the injection of anti-synapsin antibodies (●, n = 6) or preimmune serum (gray-filled circle, n = 3). ○ denotes mean values from nine control, noninjected neurons in the same preparations. C, The mean amplitude of the 10th response to the 10 Hz trains recorded in the course of a representative experiment was normalized with respect to the amplitude of the first IPSC of the train (4–6 trains were averaged at each time indicated; note that SEM bars are smaller than the symbol size) and plotted as a function of time after injection (arrow) in G423-injected (●) and noninjected (○) neurons. D, Same kind of measurements as in B except that synapsin I (▪, n = 3) or its buffer (□,n = 3) was injected. Significance of the differences observed in the responses to 10 Hz trains under the various treatments was tested as described in Figure 6. Whole train: **p < 10−9anti-synapsin versus noninjected or preimmune. Second response to 10 Hz trains: **p = 0.02 and 0.03, anti-synapsin versus noninjected and preimmune, respectively.

