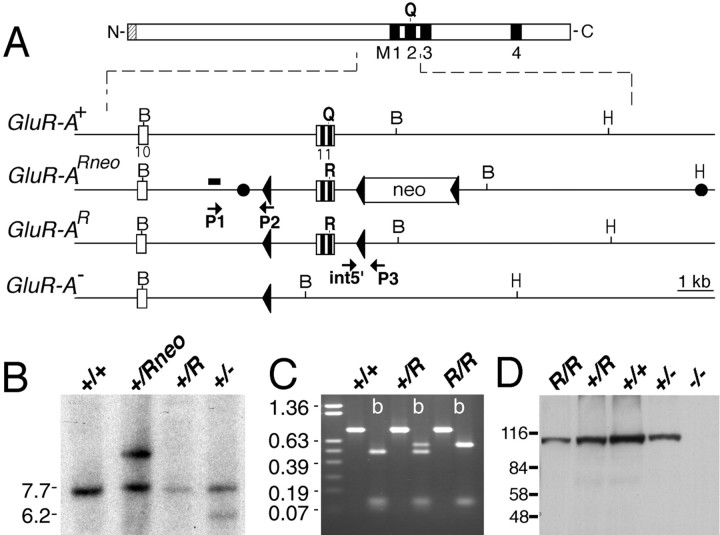
Fig. 1.
Generation of GluR-A(R/R) mice. A, Representation of the GluR-A subunit and of GluR-A+, GluR-A(Rneo), GluR-A(R), and GluR-A gene fragments.Black boxes represent putative membrane segments M1 to M4. For the gene segment, open boxes represent exonic sequences and the PGK-NEO gene (neo). loxP sites are shown by triangles. Two filled circles inGluR-Aneo indicate 5′ and 3′ ends of the targeting construct. Positions of BamHI (B) and HindIII (H) restriction enzyme recognition sites are given. The 260 bp genomic SacI fragment used as probe for the genomic Southern blot is depicted as ablack bar. P1 and P2 arrows represent primers used for screening of the targeted allele. ES cell clones were confirmed by using the primer set int5′ and P3. B, Southern blot analysis ofBamHI-digested genomic ES cell DNA derived from ES cell colonies, which were injected into blastocysts. The GluR-A+ and GluR-A(R) alleles are visualized as 7.2 kb, the targeted GluR-A(Rneo) as 9.2 kb, and the GluR-A− allele as 5.7 kb fragments, respectively. Positions of the molecular weight marker in kilobase pairs are given on the left.C, RT-PCR on total brain mRNA derived from mice with genotypes as indicated using primers exon9 and exon12EcoRI to amplify a 800 bp fragment. ByBbvI digestion (b), GluR-A and GluR(R) mRNA derived fragments of 471, 120, 106, and 103 bp and of 577, 120, and 103 bp can be visualized by ethidium bromide staining in a 1% agarose gel. Size markers in kilobases are given on theleft. D, Immunoblot analysis demonstrating the expression of the GluR-A(R) subunit in brains of GluR-A(R/R) mice. Membrane proteins of forebrain from genotypes as indicated were separated in 8% SDS-polyacrylamide gel and visualized by anti-GluR-A antibody. The molecular weight marker in kilodaltons is given on the left.

