
Fig. 2.
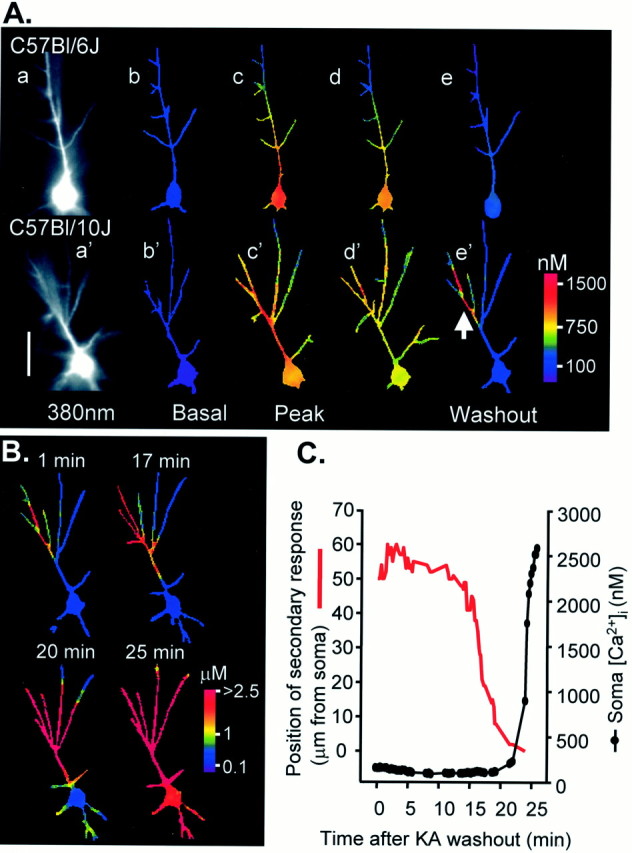
Strain differences in dendritic Ca2+ signaling after prolonged kainate (KA) exposure. A, Examples of responses to KA perfusion (10 μm, 10 min) in a Bl/6 neuron (top panels) and Bl/10 neuron (bottom panels). Fluorescence images (a, a′) show bis fura-2 excited at 380 nm. Right panels show resting and stimulated Ca2+levels as false color images. Resting Ca2+ levels (b, b′) were similar in both strains. Approximate peaks of the responses in KA are shown in c, c′. Neurons from both strains showed strong increases in Ca2+ in the proximal apical dendrite; however, Ca2+ increases in the distal dendrites (>50 μm from the soma) are much larger in the Bl/10 neuron. Dendritic Ca2+ responses also are more sustained in the Bl/10 neuron (d, d′; 15 sec after peak responses). By the beginning of the washout (e, e′) Ca2+ had returned to resting levels throughout the Bl/6 neuron. In contrast, Ca2+ levels in a portion of the apical dendritic tree of the Bl/10 neuron remain elevated (arrow in e′). Scale bar, 50 μm. B, After KA washout, Ca2+levels remain very high in this restricted dendritic region of the Bl/10 neuron and then slowly propagate throughout the neuron. Ca2+ profiles at the times indicated, in minutes, after KA washout are illustrated in the four panels. Note the change in color calibration. C, Plot showing progression of secondary Ca2+ response toward the soma (red line) and the Ca2+ levels measured in the cell soma (filled circles) during the same time course. Soma Ca2+ remains low until the secondary response reaches the soma (∼22 min after KA washout) and then rapidly rises to irrecoverably high levels.