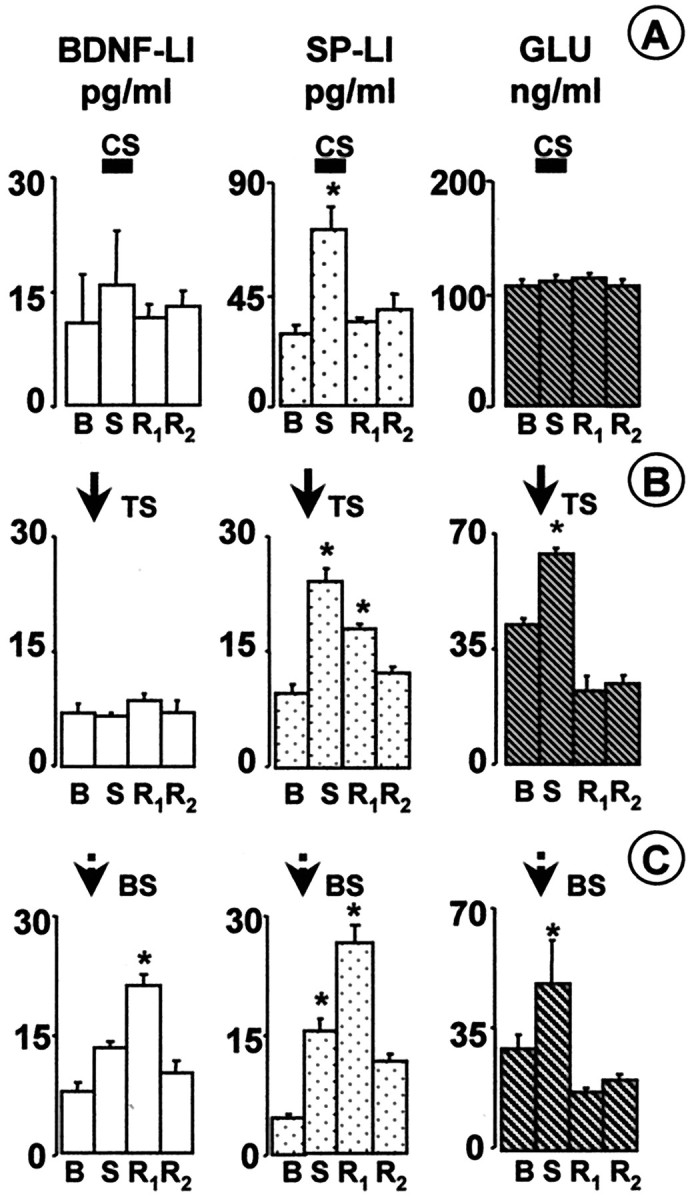
Fig. 1.

BDNF-LI, SP-LI, and glutamate (GLU) were released in the dorsal horn by different patterns of afferent fiber stimulation. Basal (B), high-threshold fiber strength-stimulated (S) and recovery (R1 andR2) fractions were collected at a rate of 1 ml/min for 8 (A) or 3 (B,C) min. Basal values (B) represent the mean of BDNF content in three fractions collected before the stimulated fraction (S).R2 values represent content in two fractions collected after the first recovery fraction (R1). Dorsal root stimulation was at high-threshold fiber strength (20 V or 5 mA, 0.5 msec) and was started at the beginning of the collection of the S fraction.A, CS of the dorsal roots at low frequency (1 Hz, 480 pulses, 8 min) induced SP-LI (n = 4 slices), but not BDNF-LI (n = 4 slices) or glutamate, release (n = 4 slices). B, TS (300 pulses in 3 trains, 100 Hz) evoked the release of SP-LI (n = 6 slices) and glutamate (n= 4 slices) but not of BDNF-LI (n = 7 slices).C, BS (300 pulses in 75 trains, 100 Hz) induced release of BDNF-LI (n = 6 slices), SP-LI (n = 7 slices), and glutamate (n = 4 slices). Values (means ± SE) express concentrations in reconstituted samples. *p < 0.05 versus both B and R2fraction values (ANOVA, followed by Tukey's test).
