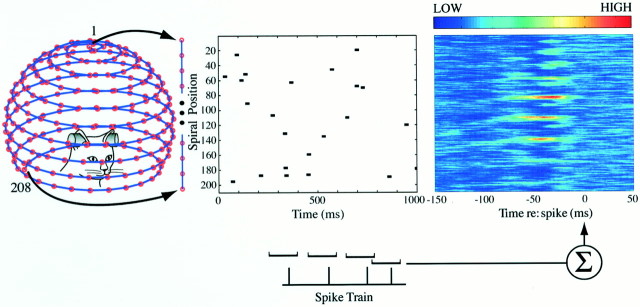
Fig. 1.
Measuring the space-time receptive field with reverse-correlation in auditory space. The input stimulus domain consists of 208 virtual free-field sound sources (speakers) positioned along a spiral path and numbered by their ordinal rank. Each source emits identical 10 msec noise bursts. To simulate the spatial positions shown on the spiral, the stimuli are convolved with filters that mimic the acoustical properties of the head and pinnae. The central panel plots on the abscissa the time of individual noise-bursts and on the ordinate, the rank number of the active sound source from the unwrapped spiral of sound directions. The first-order space-time kernelh1(k, τ) (shown on theright) is derived by averaging the stimulus episodes that occurred between 100 msec before and 50 msec after each spike. This spike-triggered average effectively gives an estimate of the posterior probability of the sound event in space-time, given that an action potential occurred. The 50 msec region following the spikes acts as a control and should not reveal any significant pattern. Because the system is necessarily causal, the portion of the kernel after the spike must appear random and average to a flat baseline. Color bar applies to this and all subsequent figures.

