
Fig. 2.
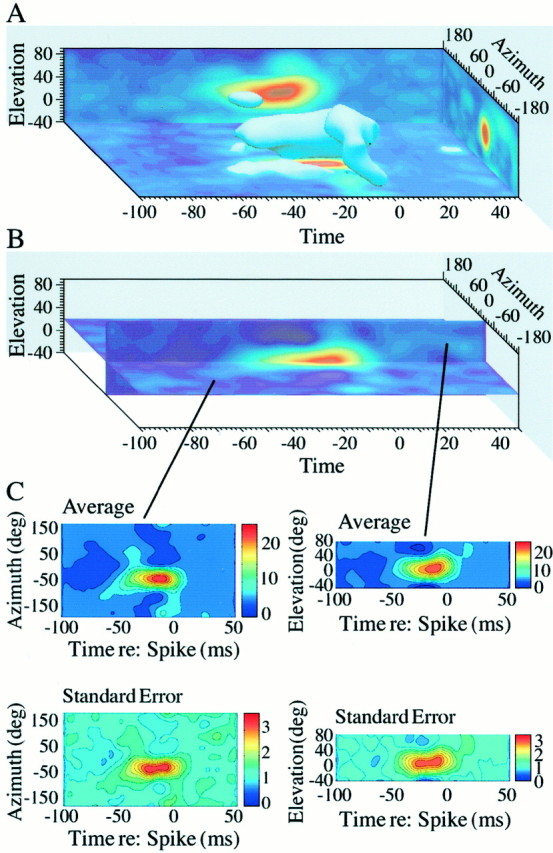
Auditory space-time receptive field estimated as a continuous function in space and time. A, Surface through this volume corresponds to an equal probability density contour. The Poisson rate λ was 10 sound events per second. This figure was derived by interpolating between measurements from the space-time kernel shown in Figure 1 and reconstructing from spiral position to spherical directions. B, Orthogonal cross-sections (one at 20° elevation and the other at −24° azimuth) taken from the receptive field of this unit. C, Bootstrapped average space-time receptive fields based on 100 resampled estimates of the space-time receptive field. Shown are the average of the 100 bootstraps and the derived SE for each position in space-time.