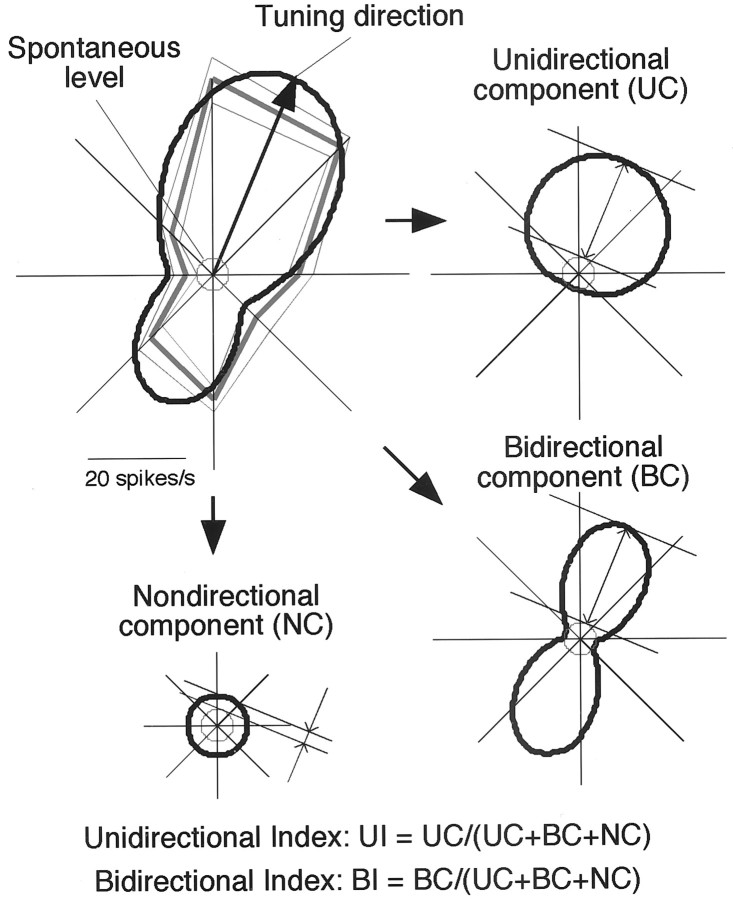
Fig. 4.
Quantification of the tuning profile with respect to the direction of elemental luminance gradients based on curve fitting. Conventions of the polar plot are the same as in Figure 3. Anarrow in the plot indicates the tuning direction. Thefitted curve is decomposed into eccentric circular, bilobed, and concentric circular curves representing UC, BC, and NC, respectively. For this cell, UC = 15.3 spikes/sec, BC = 21.2, NC = 2.8, and the maximal amplitude of the fitted curve is the sum of all three components (UC + BC + NC = 39.3). Unidirectional and bidirectional indices (UI and BI) are calculated by normalizing UC and BC to the sum of the components. For this cell, UI = 0.39 and BI = 0.54.

