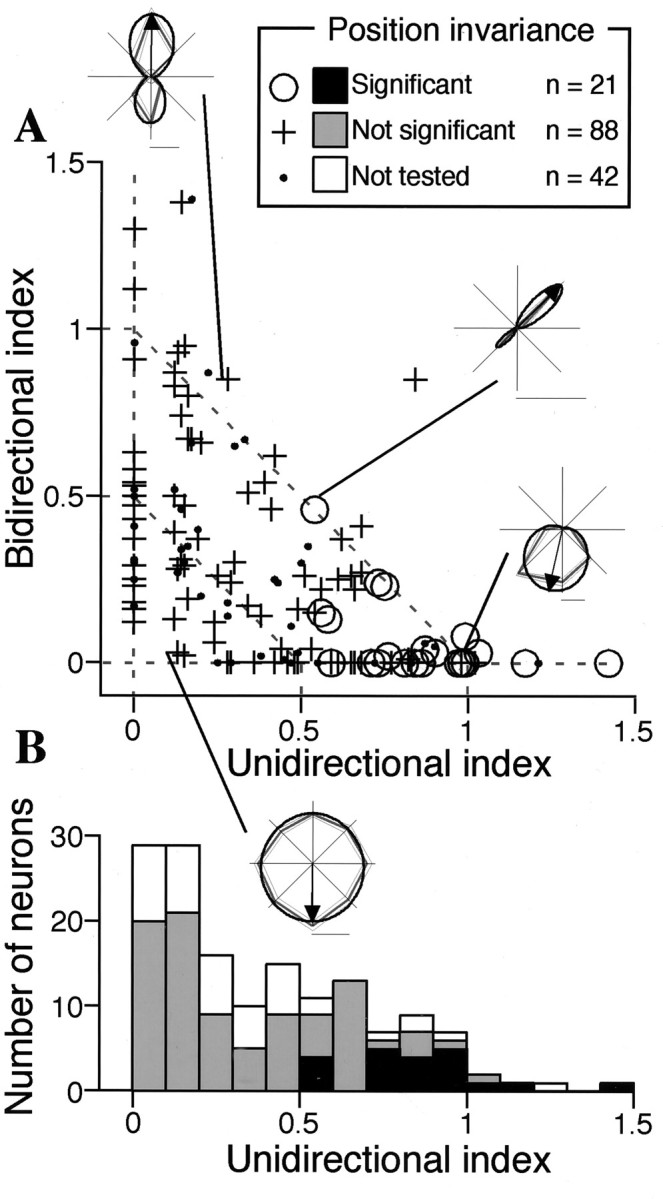
Fig. 5.

Distribution of the unidirectional and bidirectional indices. A, The bidirectional index is plotted against the unidirectional index for 151 cells that showed statistically significant modulation in response to the density–size and/or gradient–direction set. In 109 cells, invariance with respect to the position of texture element was examined (described later).Circles represent cells exhibiting invariance (unidirectional cells), and crosses represent those that do not. Four representative tuning curves are superimposed and connected with corresponding points. The broken linesconnecting each axis at a value of 1 indicate where UI + BI = 1 and the normalized amplitude of NC (NC/(UC + BC + NC)) = 0, whereas that connecting each axis at a value of 0.5 indicates where UI + BI = 0.5 and the normalized amplitude of NC is 0.5. Cells outside the former exhibited the normalized NC smaller than 0.B, Distribution of the unidirectional indices represented as a histogram.
