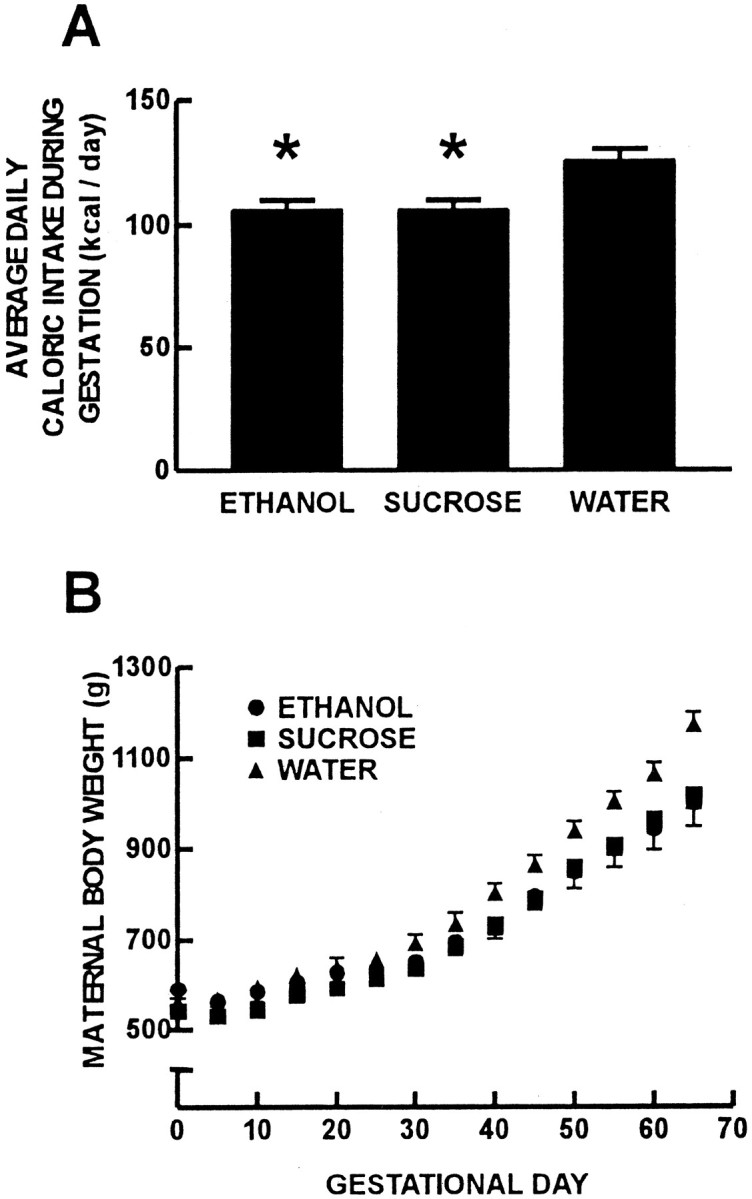
Fig. 1.

Pregnant guinea pig nutritional data for the five dams in each treatment group. Maternal average daily caloric intake during gestation (A). Pregnant guinea pigs in the ethanol treatment group consumed less food than those in the water treatment group (*p < 0.05). Pregnant animals in the isocaloric-sucrose/pair-fed treatment group were given and consumed food equal to that of the ethanol treatment group by nature of the pair-feeding regimen. B, Maternal body weight for the three treatment groups throughout gestation.Circles represent ethanol, squaresrepresent isocaloric-sucrose/pair-fed, andtriangles represent water treatment groups. Pregnant guinea pigs in the ethanol and isocaloric-sucrose/pair-fed treatment groups gained less weight than those in the water treatment group (p < 0.05).
