
Fig. 4.
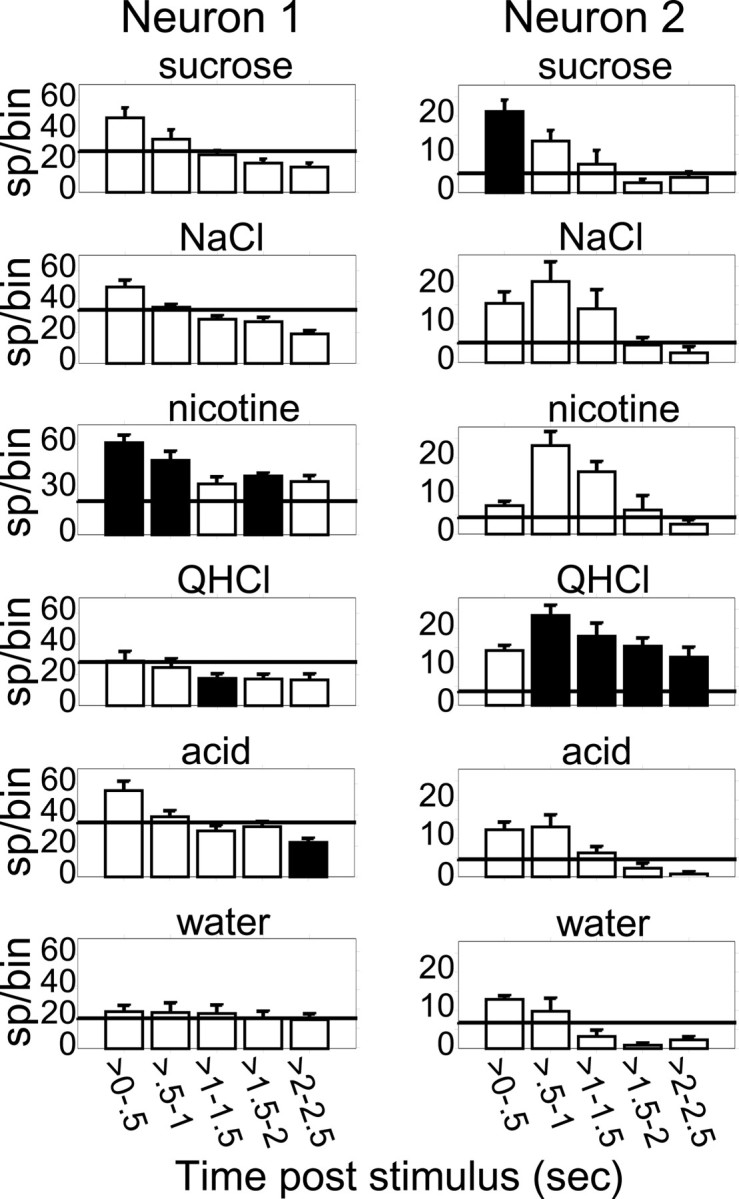
The time courses of gustatory responses in two GC neurons. The bin size is 500 msec, and error bars represent trial-wise SEMs. The horizontal line in each panel shows the average prestimulus firing rates. Filled bars represent the strongest response in that particular time bin. Neuron 1 responded to all tastants but not to water. The pattern of response (an initial excitation followed by a decline of activity over time) was similar for each tastant, but the amount of excitation varied between tastants (being greatest for nicotine and least for quinine), such that the tastant producing the most significant firing rate modulation differed at different time points. Neuron 2produced a small, time-varying response to water but produced large responses to all tastants (except acid). The responses to different tastants had different time courses, peaking earlier for sucrose than for other tastants, and peaking higher in the 0.5–1 sec bin for quinine and nicotine than for NaCl. Again, the strongest responses varied with time.