
Fig. 5.
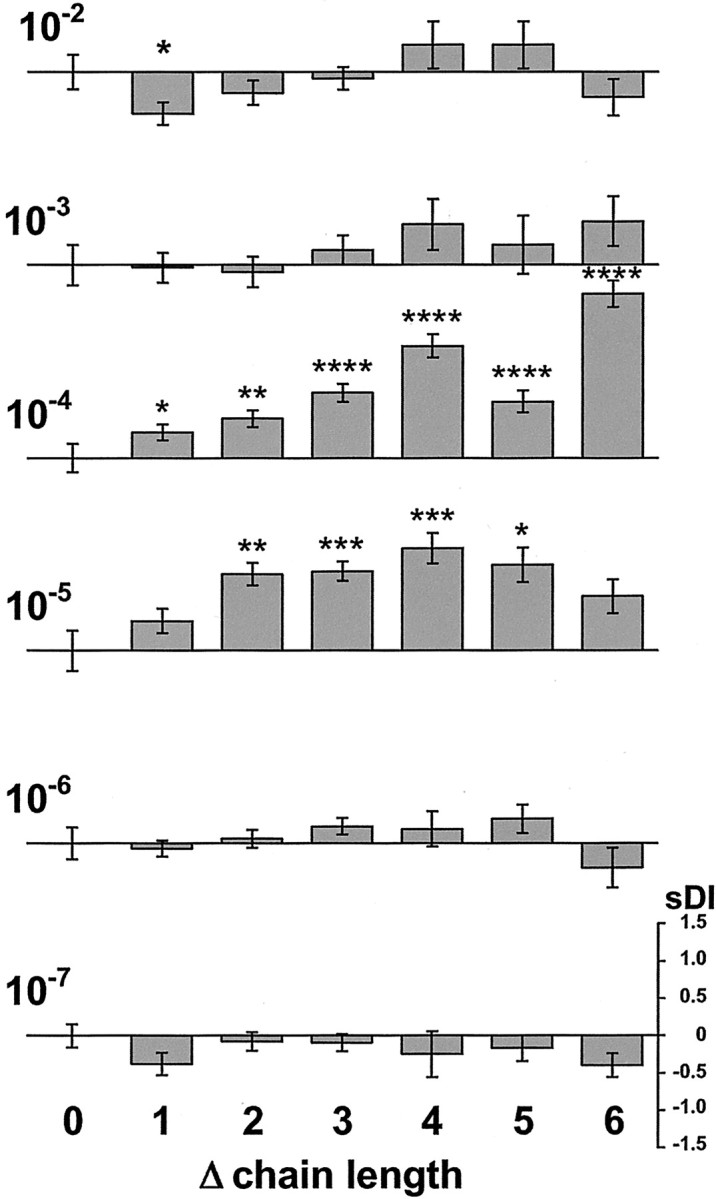
Quantitative analysis of the discriminating ability for neutral AAs at different concentrations. Specific difference indices (sDI =DIchain length pair −DIintertrial) as function of chain length difference (Δchain length = 0–6) are shown for concentrations between 10−7and 10−2m. The concentration (molar) is indicated to theleft of the corresponding bar graph. A particular chain-length difference represents data from different stimulus pairs, e.g., Δchain length = 4 contains data from image pairs gly/aha and 2-aba/2-aoa. The sDI scale to thebottom right is valid for all bar graphs.sDI values are given as means ± SEM. Stimulus concentration drastically affects the discriminating ability for differences in chain length. Discriminating ability is pronounced only at 10−4 and 10−5m. Pattern dissimilarity increases with increasing difference in carbon chain length. Significance levels of sDI values are indicated by asterisks (*p < 0.05; **p < 0.005; ***p < 0.001; ****p< 0.0001).