

Abstract
Although correlated neural activity is a hallmark of many regions of the developing nervous system, the neural events underlying its propagation remain largely unknown. In the developing vertebrate retina, waves of spontaneous, correlated neural activity sweep across the ganglion cell layer. Here, we demonstrate that L-type Ca2+ channel agonists induce large, frequent, rapidly propagating waves of neural activity in the developing retina. In contrast to retinal waves that have been described previously, these L-type Ca2+ channel agonist-potentiated waves propagate independent of fast synaptic transmission. Bath application of nicotinic acetylcholine, AMPA, NMDA, glycine, and GABAAreceptor antagonists does not alter the velocity, frequency, or size of the potentiated waves. Additionally, these antagonists do not alter the frequency or magnitude of spontaneous depolarizations that are recorded in individual retinal ganglion cells. Like normal retinal waves, however, the area over which the potentiated waves propagate is reduced dramatically by 18α-glycyrrhetinic acid, a blocker of gap junctions. Additionally, like normal retinal waves, L-type Ca2+ channel agonist-potentiated waves are abolished by adenosine deaminase, which degrades extracellular adenosine, and by aminophylline, a general adenosine receptor antagonist, indicating that they are dependent on adenosine-mediated signaling. Our study indicates that although the precise spatiotemporal properties of retinal waves are shaped by local synaptic inputs, activity may be propagated through the developing mammalian retina by nonsynaptic pathways.
Keywords: retinal waves, development, visual system, calcium imaging, network, gap junctions
Gap junctions between neurons coordinate activity in a variety of mature and developing neural networks. In the mature mammalian CNS, gap junction coupling synchronizes neural activity in a number of brain regions, including the inferior olive, the locus ceruleus, the respiratory pre-Bötzinger complex, the hippocampus, and the neocortex (Llinas et al., 1974; Christie et al., 1989; Perez-Velazquez et al., 1994; De Zeeuw et al., 1998; Galarreta and Hestrin, 1999; Beierlein et al., 2000; Fukuda and Kosaka, 2000; Perez and Carlen, 2000; Rekling et al., 2000). In the immature CNS, gap junction-mediated correlated activity is thought to subserve several critical developmental processes, including neuronal migration, differentiation, and synapse formation in areas including the neocortex (Connors et al., 1983; Peinado et al., 1993; Kandler and Katz, 1995; Schwartz et al., 1998; Roerig and Feller, 2000), spinal cord (Chang et al., 1999; Chang and Balice-Gordon, 2000;Tresch and Kiehn, 2000), and hippocampus (Venance et al., 2000).
In the developing vertebrate visual system, spontaneous correlated activity in the retina is required for the refinement of connections between the retina and its primary target in the thalamus, the lateral geniculate nucleus (LGN) (for review, see Shatz, 1996; Penn et al., 1998; Wong, 1999). In developing chick retinas, spontaneous waves of excitation (“retinal waves”) spread via gap junctions, although their propagation is modulated by the synaptically released neurotransmitters, GABA, glycine, glutamate, and acetylcholine (ACh) (Catsicas et al., 1998; Wong et al., 1998; Sernagor et al., 2000). Similarly, spontaneous retinal waves observed in the developing mammalian retina require synaptic transmission mediated by the fast neurotransmitters, ACh and glutamate, as well as the neuromodulator, adenosine (Feller et al., 1996; Zhou, 1998; Stellwagen et al., 1999;Wong et al., 2000; Zhou and Zhao, 2000) (for review, see Wong, 1999). The role that gap junction coupling plays in the mammalian system, however, has yet to be elucidated.
We used the developing mouse retina to investigate the interaction between gap junctions and synaptic circuits that could shape patterns of retinal waves, which reflect correlated, spontaneous neural activity. Here, we describe a novel form of propagating activity that requires L-type Ca2+ channel activation. In contrast to previously described retinal waves, this activity propagates independently of fast synaptic transmission. Like normal retinal waves, however, it is inhibited by blockers of gap junctions and antagonists of adenosine signaling. Our observations indicate that the retina is a heterogeneous neural substrate in which neural activity can spread through a number of interacting pathways.
MATERIALS AND METHODS
Retinal preparation. All procedures were performed in accordance with approved animal use protocols at the National Institutes of Health. Retinas were isolated as described previously (Bansal et al., 2000). Briefly, newborn mice [postnatal day 0 (P0)-P13] were anesthetized with halothane and decapitated. Retinas were isolated in cold (4°C) artificial CSF (ACSF) containing (in mm): 119.0 NaCl, 26.2 NaHCO3, 11 glucose, 2.5 KCl, 1.0 KH2PO4, 2.5 CaCl2, and 1.3 MgCl2. Retinas were cut into thirds and mounted, ganglion cell side up, onto filter paper. These whole-mount preparations were kept at 32°C in ACSF bubbled with 95% O2/5% CO2 until use (1–6 hr). During experiments, all preparations were superfused continuously with oxygenated ACSF warmed to 32°C.
Tracer coupling. Individual ganglion cells (one per whole mount) were filled with Neurobiotin (1% by weight in pipette solution; Vector Laboratories, Burlingame, CA) during whole-cell recordings lasting ∼20 min at 32°C. Avidin (0.1%; Jackson ImmunoResearch, West Grove, PA) was included in the superfusate before gigaseal formation and during pipette withdrawal to bind any spilled Neurobiotin. After recordings, retinas were incubated for 1–2 hr in ACSF at 32°C and then fixed in 4% paraformaldehyde in PBS overnight. Neurobiotin was visualized by antibody labeling. Retinas were washed in Tris-buffered saline (TBS) and then permeabilized in TBS containing 20% donkey serum, 5% sucrose, and 0.5% Triton X-100 for 2 hr. Anti-biotin antibody (Vector Laboratories) was diluted (1:100) into this solution, and the retinas were incubated for 18 hr at 4°C. Then, retinas were washed in TBS and treated again with TBS containing 20% donkey serum and 5% sucrose for 2 hr. A fluorescent secondary antibody (Jackson ImmunoResearch) was diluted (1:200) into this solution, and the retinas were incubated for 45 min. Finally, retinas were washed, first in TBS with 0.1% Tween 20 and then in TBS alone, counterstained with 4′,6′-diamidino-2-phenylindole (DAPI) (10 μm), and mounted in VectaShield (Vector Laboratories). Neurobiotin-filled cells were visualized using a confocal microscope (LSM 410; Zeiss, Thornwood, NY) and optically sectioned into 0.5 μm slices. Stacks of these sections were reconstructed using MetaMorph (Universal Imaging, West Chester, PA), and the number of coupled cells was counted. The position of cells within the ganglion cell or inner nuclear layer (identified from DAPI staining) was determined from their depth in the stack.
Fluorescence imaging. For studies of functional gap junction coupling, fluo-4 AM was perfused locally into the ganglion cell layer via a large-bore glass pipette for 15 min. Subsequently, neurons were imaged under a 40× water-immersion objective (Olympus Optical, Tokyo, Japan), and whole-cell current-clamp recordings were made from single, visualized retinal ganglion cells (RGCs) (see Electrophysiology below). The indicator dye, fluo-4 AM, was excited at 500 msec intervals by a shuttered light source (DG-4; Sutter Instruments, Novato, CA) that triggered a current injection (usually 10–25 pA for 1 sec to elicit a train of action potentials) after several control exposures. A charge-coupled device camera was used to capture the resultant images (Micromax; Princeton Instruments, Trenton, NJ). Three separate stacks of sequential images were averaged and analyzed using MetaMorph software to reveal changes in intracellular Ca2+ concentration elicited by depolarization. Neurons were considered to be coupled to the stimulated RGC if they exhibited an increase in fluo-4 fluorescence within one frame (500 msec) of the current injection in all three trials.
Retinal whole-mount preparations were incubated with 10 μm fura-2 AM or fluo-4 AM (Molecular Probes, Eugene, OR) (indicator dyes were dissolved into DMSO with 2% pluronic acid; the final DMSO concentration was 1%, and the final pluronic acid concentration was 0.02%) in oxygenated ACSF for 2–6 hr. Retinal preparations were placed, ganglion cell side up, in a chamber on the stage of an upright microscope (Axioskop or Axioskop 2 FS; Zeiss). Observations of retinal waves were made under a 5× air-interface objective (Zeiss) using continuous 380 nm illumination (OptiQuip) of fura-2 AM. Images were acquired with a silicon-intensified target video camera (MIT 300; Dage-MTI, Michigan City, IN); an initial background frame was acquired, and this frame was subtracted on a pixel-by-pixel basis from all subsequent frames to create a difference image. The difference image was averaged over four video frames by a digital video processor (DVP-32; InstruTech, Port Washington, NY) and recorded onto s-videotape (Panasonic, Tokyo, Japan) with a time resolution of 120 msec/frame. Fractional changes in average fluorescence intensity (ΔF/F) were monitored over a 200 μm2 area to determine the interwave interval of spontaneous, correlated activity in the retinal preparation. Recorded images were digitized and analyzed using LabView (National Instruments, Austin, TX) and NIH Image software to determine the area, velocity, and interevent interval of the observed waves.
Electrophysiology. Whole-cell current-clamp recordings were made from visualized ganglion cells (40× water-immersion objective;Olympus Optical). Borosilicate glass pipettes (Clark/Warner Instruments, Hamden, CT) were pulled (P-97; Sutter Instruments) to a tip resistance of ∼5 MΩ when filled with an internal solution containing (in mm): 98.3 potassium gluconate, 40 HEPES, 1.7 KCl, 0.6 EGTA, 5 MgCl2, 2 Na2ATP, and 0.3 Tris-GTP; pH was adjusted to 7.25 with KOH. Recordings were made using an Axopatch 200B patch-clamp amplifier (Axon Instruments, Foster City, CA), and data were acquired to a Pentium-based personal computer using pClamp 6.0 software (Axon Instruments). Data were analyzed using pClamp and LabView 5.0 software (National Instruments, Austin, TX).
Pharmacology. All drugs came from Research Biochemicals (Natick, MA) or Sigma (St. Louis, MO). Adenosine deaminase and aminophylline were dissolved directly in ACSF at their working concentrations; all other drugs were prepared as concentrated stock solutions as follows: BayK-8644 and nifedipine in DMSO; FPL-64176 in 100% ethanol; 18α-glycyrrhetinic acid (18α-GA) in a 4:1 mixture of methanol and NaOH; DNQX in 0.3N NaOH; all others in H2O. Stocks were stored at −20°C and diluted 1:1000 into ACSF on the day of the experiment.
Data under each experimental condition are reported as mean ± SD. Changes are considered significant when p < 0.05 by ANOVA (Excel).
RESULTS
Functional gap junction coupling in the developing mouse ganglion cell layer
Gap junction coupling, revealed by intracellular injection of tracers, is a well studied feature of the mature vertebrate retina (Baldridge et al., 1998; Mills and Massey, 2000). This intercellular coupling is also present in the developing retina, as has been demonstrated in both the chick (Catsicas et al., 1998) and the ferret (Penn et al., 1994). These studies showed that RGCs are tracer-coupled to RGCs of the same class as well as to amacrine cells in the inner nuclear layer (INL) and displaced amacrine cells in the ganglion cell layer (GCL).
Here, we investigated gap junction coupling between RGCs and other neurons in the developing inner retina of the mouse. We visualized neurons in the retinal whole-mount preparation and, using whole-cell recording techniques, filled individual RGCs with the tracer molecule, Neurobiotin. The RGCs with the largest somas were targeted, and these neurons likely correspond primarily to α-ganglion cells because of their large primary dendrites and regular dendritic branching patterns (Peichl et al., 1987; Penn et al., 1994; Doi et al., 1995; Tagawa et al., 1999). The filled cells were reacted with an anti-Neurobiotin primary antibody and labeled with a fluorescent secondary antibody. Subsequently, gap junction-coupled neurons were visualized and reconstructed using a confocal microscope. We found that developing mouse RGCs were tracer-coupled to other RGCs and to both amacrine cells in the INL and presumptive displaced amacrine cells (based on soma size and dendritic morphology) in the GCL. When all filled RGCs were analyzed as a single population, each was, on average, tracer-coupled to six to eight neurons in the GCL and six to eight neurons in the INL (Fig. 1A) (n = 47 filled RGCs), and the extent of Neurobiotin coupling did not change substantially between P0 and P13 (eye-opening in the mouse occurs at P14) (Fig. 1A). This differs from the ferret retina, in which Neurobiotin coupling between RGCs increases postnatally (Penn et al., 1994).
Fig. 1.

Anatomical and functional gap junction coupling in the developing mouse retina. A,Top, Projection of Neurobiotin-coupled neurons reconstructed from confocal sections taken from a P7 mouse retina. The ganglion cell in the center was filled with tracer; coupled ganglion cells (note the filled axons in the bottom left corner) are observed in the GCL, and coupled amacrine cells are seen in both the GCL and INL. Scale bar, 20 μm. Bottom, Summary of Neurobiotin coupling throughout postnatal development before eye opening at P14; error bars are ±SD (n = 47 filled RGCs). B, Top, Fluorescence image of the ganglion cell layer from a P2 mouse retina incubated in fluo-4 AM. Intracellular Ca2+ elevations in neurons (pseudocolored red) are elicited by current steps (1 sec, 15 pA) injected into a recorded RGC (circled inblack). The image is the average of responses to three repeated trials. Scale bar, 10 μm. Bottom left, Thetop traces are whole-cell current-clamp responses of an RGC to a current injection before and 10 min after bath application of 18α-GA to the retina. The bottom traces are examples of intracellular Ca2+ fluorescence signals elicited in nonrecorded cells by these current injections (indicated by thearrow at point 4) observed before (circles) and after (triangles) 18α-GA treatment. Bottom right, Summary histogram plot of the percentage blockade of ΔF/F in 25 neurons in the GCL after current injection into nine RGCs; the x-axis represents the degree of block by 18α-GA, binned by 20% intervals, and they-axis represents the percentage of cells for which each degree of blockade is observed.
We also assayed functional electrical coupling between RGCs and other neurons in the GCL. In a retina loaded with the fluorescent Ca2+ indicator fluo-4 AM, a depolarizing current step that elicited repetitive spiking in a single recorded RGC caused an increase in fluo-4 fluorescence, reflecting an increase in [Ca2+]i, in several surrounding neurons (average number of cells coupled, 2.78 ± 1.7; n = 9 recorded RGCs) (Fig.1B). The number of coupled cells revealed by this method was lower than that seen using the Neurobiotin tracer, owing in part to a smaller field of view. The distribution of coupled neurons seen with both techniques was similar in that coupled cells were always several soma diameters away from the injected or recorded cell and from each other as well. Bath application of the gap junction antagonist, 18α-GA (25 μm) (Davidson et al., 1986;Davidson and Baumgarten, 1988), which occludes waves in the chick retina (Wong et al., 1998), either blocked or significantly attenuated these fluorescence increases (average reduction in ΔF/F, 69.9 ± 34.7%; n = 25 neurons coupled to nine recorded RGCs) (Fig. 1B). At a higher concentration (100 μm) that might antagonize gap junctions more strongly, 18α-GA altered repetitive action potential firing in RGCs (our unpublished observations; data not shown). Consequently, we used a relatively low concentration of 18α-GA to minimize any nonspecific effects of the drug on cell membrane properties (resting membrane potential was unchanged; note the unaltered repetitive action potential firing illustrated in Fig.1B). These fluorescence imaging experiments, together with the Neurobiotin tracer studies, demonstrate that in the developing mouse retina, RGCs are coupled extensively to other cells. Although gap junctions between RGCs are not likely to be the only pathway for retinal wave propagation, these results indicate that coupling between retinal neurons can be inhibited effectively by 18α-GA. Below, we explore the role of gap junctions in retinal wave propagation.
A gap junction antagonist inhibits retinal wave propagation
Imaging of the fluorescent Ca2+indicator, fura-2, has revealed that retinal waves induce an increase in [Ca2+]i on the order of 50 nm in individual amacrine and ganglion cells (Wong et al., 1995). This increase in [Ca2+]i causes a substantial change in fura-2 fluorescence (ΔF) that allows the spatial extent of wave propagation across several square millimeters of the retina to be monitored (Feller et al., 1996, 1997). Such observations have revealed that retinal waves are initiated locally and propagate over a spatially restricted region called a domain (Feller et al., 1997). In the developing mouse retina, we found that a local region of the GCL exhibited spontaneous increases in [Ca2+]i with a mean interwave interval (i.e., the time elapsed between spontaneous ΔF transients in a given retinal region) of 83.6 ± 32.3 sec (n = 36 retinas). The average domain size was 0.19 ± 0.21 mm2, corresponding to 9.7 ± 9.8% of the imaged retinal area (n = 229 waves from six retinas), and the average retinal wave propagated with an average wave front velocity of 110.6 ± 25.0 μm/sec (n = 56 waves from six retinas). These waves resemble those observed in ferret and rabbit retinas, although they propagate more slowly (wave velocity is ∼175 μm/sec in ferret and ∼150–300 μm/sec in rabbit) and have a shorter interwave interval (interwave interval is ∼115 sec in ferret and 24–480 sec in rabbit) (Feller et al., 1996,1997; Zhou and Zhao, 2000). They are similar, also, to retinal waves observed in early [embryonic day 8 (E8)-E11], but not late (E16, when waves become substantially faster, larger, and less frequent), embryonic chick retinas (Catsicas et al., 1998; Wong et al., 1998;Sernagor et al., 2000) (for review, see Wong, 1999). Examples of retinal waves recorded from a P2 mouse retina are available as QuickTime movies at http://www.biology.ucsd.edu/labs/feller/ JNEUROSCI.html.
Next, we investigated the involvement of gap junction-mediated signaling in spontaneous activity propagation through the neonatal retina. Blocking gap junctions with 18α-GA (25 μm) had two effects. First, it increased significantly the interval between waves (205.4 ± 152.1 sec; n = 6 retinas;p < 0.001) (Fig.2B,C). Second, 18α-GA decreased the domain size (mean area, 0.13 ± 0.11 mm2, or 5.5 ± 5.1% of retinal area; n = 52 waves from three retinas) (Fig.2A,C). These effects were reversible, as illustrated in Figure 2B. In contrast, the wave front velocity in 18α-GA (102.5 ± 37.8 μm/sec;n = 4 waves) was not significantly different from that of the control waves. Note that the propagation velocity of waves in the presence of 18α-GA was difficult to determine because the waves were quite small and did not propagate very far from their point of initiation. Because the predominant effect of gap junction blockade is a reduction in the area covered by a single spontaneous event, these observations indicate that gap junctions are involved in the propagation of synaptically driven neural activity away from its point of origin.
Fig. 2.
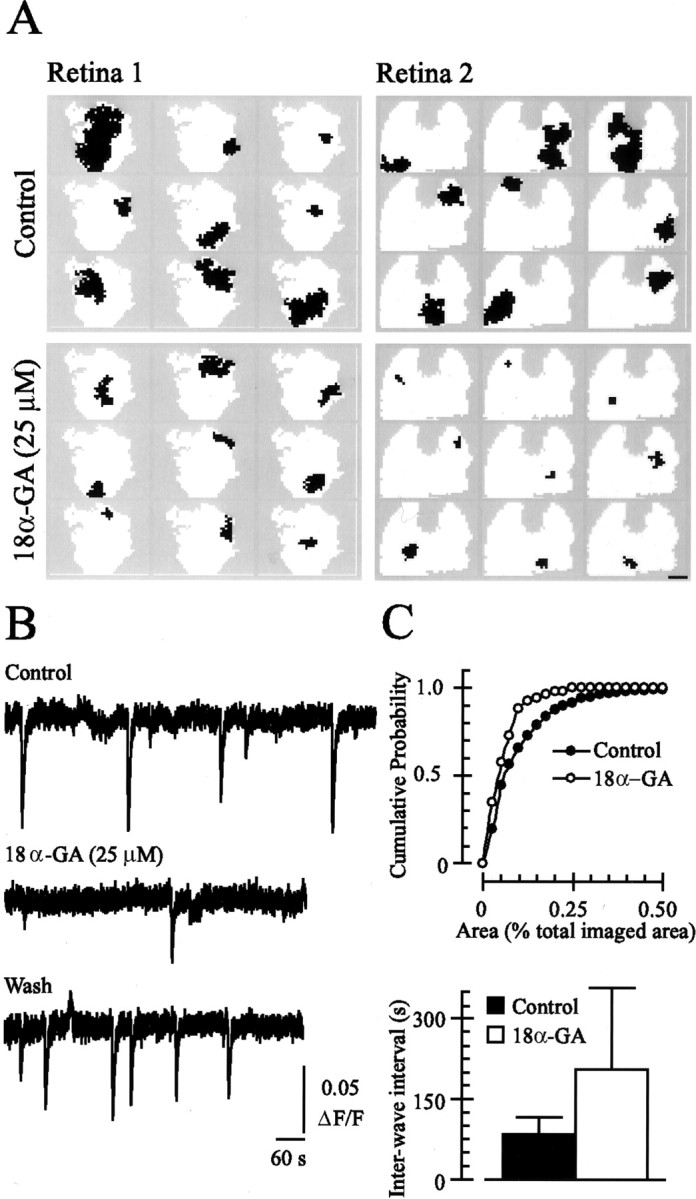
A gap junction blocker reduces the size of and the interval between retinal waves. A, Domains (total area covered by a single retinal wave) of consecutive waves recorded from two retinal preparations (total imaged area is shown inwhite) in control conditions (top) or after treatment with 18α-GA for 15 min (bottom) using fluorescence imaging of retinas incubated in fura-2 AM. Scale bar (lower right corner), 0.5 mm. B, The fura-2 ΔF/F, averaged over 200 μm2 of the GCL, in control solution (top trace), after a 15 min application of 18α-GA (25 μm; middle trace), and after a 15 min rinse (bottom trace). The downward deflections correspond to decreases in 380 nm fluorescence associated with waves propagating through the region of retina.C, Summary of the effects of 18α-GA on wave area [top, cumulative histogram is a summary of 281 waves from 9 retinas; bottom, interwave interval (time between fluorescence transients observed in a given retinal area) graph is a summary of data from n = 42 retinas].
L-type Ca2+ channel agonists enhance wave activity, even in the absence of fast synaptic transmission
Spontaneous generation of retinal waves requires Ca2+-dependent synaptic transmission from retinal interneurons (Feller et al., 1996). Neurotransmitter release from most mature retinal interneurons is mediated by Ca2+ influx through L-type Ca2+ channels (Gleason et al., 1994;Schmitz and Witkovsky, 1997; Witkovsky et al., 1997; Hartveit, 1999) (for review, see Matthews, 1999). Consistent with this, the L-type Ca2+ channel antagonist, nifedipine (50 μm), blocked all retinal wave activity as assayed by both Ca2+ fluorescence imaging (n = 3 retinas) and electrophysiological recording (n = 4 RGCs).
We sought to alter the normal balance of the synaptic and nonsynaptic (i.e., gap junction-mediated) mechanisms that contribute to wave propagation in the developing mammalian retina by potentiating synaptic transmission-dependent signaling with the L-type Ca2+ channel agonists BayK-8644 or FPL-64176 (1–5 μm). Bath application of BayK or FPL decreased dramatically the interwave interval (13.5 ± 5.2 sec;n = 16 retinas) (Fig.3B,D) and produced waves that usually propagated across the entire retinal preparation (domain size, 2.08 ± 1.16 mm2, or 85.3 ± 23.7% of the imaged retinal area; n = 65 waves from three retinas) (Figs.3A, 4B) at a velocity almost twice that of control waves (192.3 ± 44.8 μm/sec; n = 72 L-type Ca2+ channel agonist-potentiated waves from three retinas) (Figs. 3A, 4B). Like control waves, L-type Ca2+ channel agonist-potentiated waves observed with both Ca2+ fluorescence imaging (n = 2 retinas) and electrophysiological recording (n = 5 RGCs) were blocked by nifedipine (50 μm). Together, these data indicate that L-type Ca2+ channel activation is required for spontaneous activity to propagate through the developing retina.
Fig. 3.
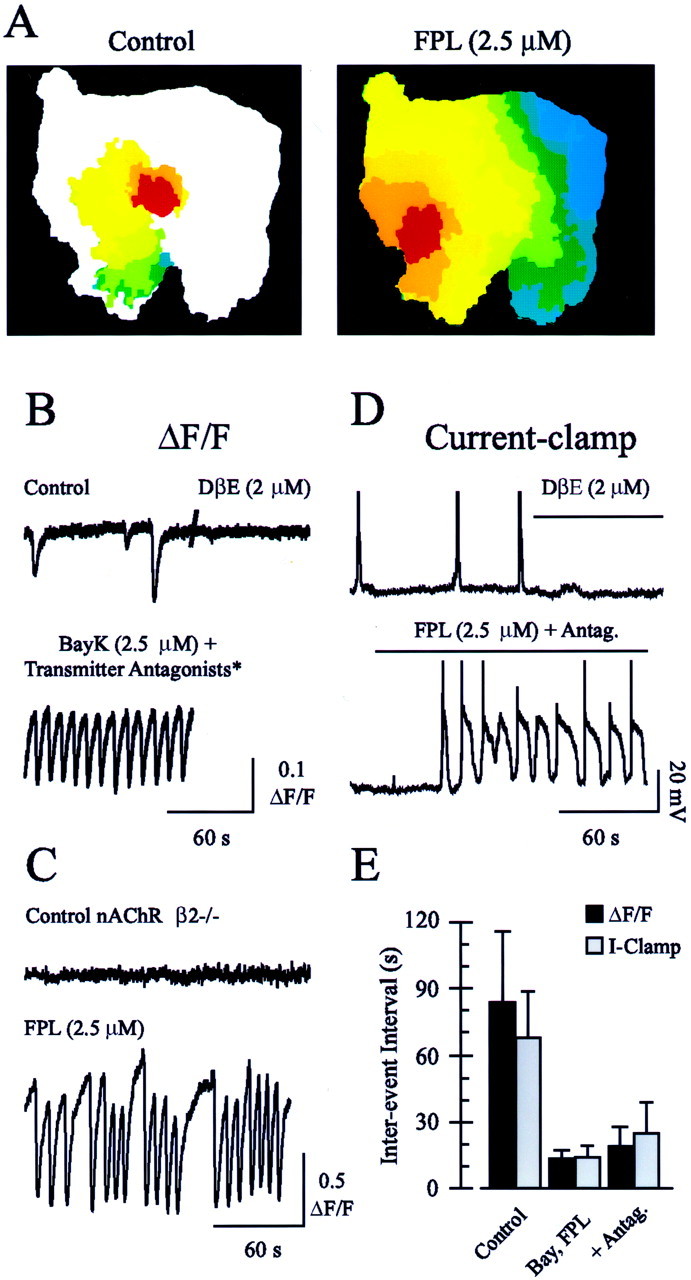
L-type Ca2+ channel agonists induce large, frequent, rapidly propagating waves of activity that persist in the presence of neurotransmitter antagonists that abolish control retinal waves. A, The evolution of individual retinal waves in control (left) and FPL-containing (right) conditions. Each color represents the wave area at time intervals of 1 sec, with the wave propagating fromred to green to blue.B, The time course of ΔF/F of fura-2 under control conditions (top left trace), after blockade of waves with DHβE (2 μm;top right trace), and in the presence of BayK and antagonists of AMPA–kainate (DNQX; 25 μm), NMDA (d-APV; 50 μm), GABAA (bicuculine methiodide; 10 μm), and glycine (strychnine; 2 μm) receptors (bottom trace), as indicated by theasterisk. C, ΔF/F averaged over a 200 μm2 area in a retina taken from a mouse lacking the β2 subunit of the nAChR under control conditions and after bath application of FPL (bottom trace).D, A whole-cell current-clamp recording from an RGC in control conditions (top left trace) and in the presence of DHβE (2 μm;top right trace).Bottom trace, current-clamp recording in the presence of FPL and the neurotransmitter antagonists listed above.E, Summary of the effects of L-type Ca2+ channel agonists on interwave (ΔF/F) or interburst (I-Clamp) intervals [for Control, L-type Ca2+channel agonist (Bay, FPL), and agonist + fast transmitter antagonist (+Antag.) conditions, respectively, n = 36, 16, and 23 retinas for ΔF/F; n = 37, 16, and 19 RGCs for current-clamp].
Fig. 4.

Blockade of gap junctions reduces the interwave interval, area, and velocity of L-type Ca2+ channel agonist-potentiated waves. A, Domains (black) of consecutive waves under control conditions (left), after bath application of FPL (2.5 μm;middle), and after treatment with 18α-GA (25 μm; right) for 15 min. Total imaged area of the retina is shown in white. Scale bar (lower right corner), 0.5 mm. B, Summary of the effects of 18α-GA on L-type Ca2+ channel agonist-potentiated wave interwave interval (left), area (middle), and velocity (right).
To determine whether L-type Ca2+ channel agonists were exerting their effect by potentiating cholinergic neurotransmission, which is required for wave activity at this stage of development (Bansal et al., 2000), we blocked retinal waves with the nicotinic acetylcholine receptor (nAChR) antagonist, dihydro-β-erthroidine (DHβE; 2 μm), and then coapplied L-type Ca2+ channel agonists and DHβE (Fig. 3B). Surprisingly, BayK- or FPL-potentiated waves persisted in the absence of nAChR-mediated neurotransmission. Indeed, these waves persisted even in the presence of DHβE and antagonists of the glutamate, GABAA, and glycine receptors that have been shown to mediate or modulate retinal waves in a variety of preparations (Fig. 3B) (Feller at al., 1996;Wong and Oakley, 1996; Sernagor and Grzywacz, 1999; Wong et al., 2000;Zhou and Zhao, 2000). These receptor antagonists (referred to collectively as “fast transmitter antagonists” in the remainder of this manuscript) had a small, but statistically significant, effect on the interwave interval of the L-type Ca2+channel agonist-induced waves (Fig. 3E) (18.6 ± 8.6 sec, n = 23, vs 13.5 ± 5.2 sec with L-type Ca2+ channel agonists alone,n = 16; p = 0.02) but did not prevent waves from propagating across a large percentage of the imaged region of the retina at an elevated velocity.
To confirm that these potentiated waves were independent from the nAChR-dependent retinal waves that have been described previously, we examined a mouse that lacks the β2 nAChR subunit (Xu et al., 1999) and does not exhibit retinal waves, as assayed by fluorescent indicator imaging, during the first postnatal week (Bansal et al., 2000). Although no correlated, spontaneous neural activity could be observed in retinas isolated from these mice, they exhibited a robust response to FPL application (Fig. 3C). The waves induced by FPL propagated across the entire preparation of β2−/− mouse retina, just as in wild-type retinas, although the interval between waves was increased relative to wild-type animals (26.3 ± 15.5 sec;n = 8 retinas).
Simultaneous fluorescence imaging and electrophysiological recordings have demonstrated that RGCs receive synaptic input and fire bursts of action potentials when they participate in waves (Feller et al., 1996;Penn et al., 1998). To determine whether the fluorescence signal that we recorded in the presence of the L-type Ca2+ channel agonists and neurotransmitter antagonists reflected depolarizing electrical activity, we made whole-cell current-clamp recordings from individual RGCs (Fig.3C). Under control conditions, RGCs depolarized and fired bursts of action potentials at intervals approximating the interwave interval measured with fluorescence imaging (Fig.3D,E) (interevent interval, 67.4 ± 20.9 sec; n = 37 RGCs). Like retinal waves observed by fluorescence imaging of fura-2, these depolarizations were blocked by bath application of the nicotinic antagonists, DHβE or curare (2 or 100 μm; n = 4). Also consistent with our imaging results, RGCs burst much more frequently in the presence of the L-type Ca2+ channel agonists and fast neurotransmitter antagonists (interevent interval, 13.9 ± 5.4 sec; n = 16 RGCs, in BayK or FPL alone; 23.4 ± 12.8 sec, n = 19 RGCs, in BayK or FPL plus transmitter antagonists) (Fig. 3D,E). In the presence of BayK or FPL, the resting membrane potentials of RGCs remained the same as under control conditions, and a plateau depolarization followed each burst of action potentials (Fig.3C, bottom trace). Such plateau potentials are characteristic of enhanced L-type Ca2+channel activity, as examined most extensively in motoneurons (Hounsgaard and Kiehn, 1989). These recordings confirm that the rapidly propagating, large waves potentiated by L-type Ca2+ channel agonists reflect an increase in the spontaneous, periodic depolarization of retinal neurons.
One interpretation of enhanced wave propagation in the presence of BayK and FPL is that the dramatic increase in RGC action potential activity raises the extracellular potassium concentration ([K+]e) in the inner retina, thereby enhancing the excitability of neurons. Previously, localized high [K+]e coupled with cholinergic synaptic transmission was proposed as a mechanism of wave propagation in the turtle retina (Burgi and Grzywacz, 1994; Sernagor and Grzywacz, 1999). Here, we used several experimental manipulations to investigate the influence of [K+]e on L-type Ca2+ channel agonist-potentiated waves in mouse retina. First, we applied tetrodotoxin (TTX, 1 μm), which will block voltage-gated Na+channels and thereby eliminate action potential-induced changes in [K+]e, to the retina. Whole-cell current-clamp recordings made in the presence of TTX and L-type Ca2+ channel agonists and fast transmitter antagonists showed that RGCs continued to depolarize with the same frequency (n = 5). In addition, using fluorescence imaging, we observed that in TTX (1 μm) and fast transmitter antagonists, L-type Ca2+ channel agonist-induced waves occurred with the same frequency and propagated across the entire retinal preparation with the same velocity (n = 5). Second, we blocked K+ channels directly with extracellular Cs+ (1 mm) and tetraethylammonium chloride (1 mm) and found that the domain size of L-type Ca2+ channel agonist-induced waves (in the presence of fast transmitter antagonists) was unchanged, although the interwave interval was increased slightly (interval, 130 ± 20% of L-type Ca2+ channel agonists and fast transmitter antagonists alone; n = 4 retinas). We conclude that L-type Ca2+ channel agonist-potentiated waves in mouse retinas are propagated by a nonsynaptic mechanism independent of extracellular K+.
Blockade of gap junctions and depletion of extracellular adenosine inhibits L-type Ca2+ channel agonist-induced waves
Above, we showed that gap junction coupling can contribute to determining the area over which retinal waves propagate. Here, we show that L-type Ca2+ channel agonist-potentiated waves are propagated also in part by gap junction-dependent processes. Bath application of 18α-GA (25 μm), which blocks functional coupling between RGCs (Fig.1), had three effects on the L-type Ca2+channel agonist-induced waves (examples are illustrated in Fig.4A). First, it increased significantly the average interval between waves from 13.5 ± 5.2 sec (n = 16 retinas) to 44.3 ± 25.9 sec (n = 4 retinas;p < 0.001) (Fig. 4B). Second, it reduced dramatically the average domain size from 2.08 ± 1.16 mm2 (85.3 ± 23.7% of imaged retina;n = 65 waves from three retinas) to 0.48 ± 0.88 mm2 (15.9 ± 23.2% of imaged retina;n = 41 waves from two retinas; p < 0.001) (Fig. 4B). Third, it reduced the wave propagation velocity from 192.3 ± 44.8 μm/sec (n = 72 waves from three retinas) to 108.9 ± 44 μm/sec (n = 45 waves from two retinas;p < 0.001) (Fig. 4B). Interestingly, propagation velocity was not reduced below control levels, indicating that it is not limited by gap junction coupling. Based on these findings, we conclude that as in normal wave activity, gap junctions between neurons in the developing inner retina participate in the propagation, but not the initiation, of L-type Ca2+ channel agonist-induced activity.
Recently, it was demonstrated that the size and propagation velocity of retinal waves are modulated by the intracellular cAMP concentration set by adenosine receptor activation (Stellwagen et al., 1999). In particular, it was found that bath application of the adenylate cyclase activator, forskolin, or the adenosine receptor agonist, 5′-N-ethylcarboxamidoadenosine, increased wave area and propagation velocity, and that depletion of extracellular adenosine with the enzyme, adenosine deaminase, inhibited wave activity. To determine whether adenosine receptor activation is required for L-type Ca2+ channel agonist-potentiated waves, we performed similar experiments in mouse retina.
As observed in ferret retinas (Stellwagen et al., 1999), incubation of mouse retinas in adenosine deaminase (3 U/ml), to degrade free adenosine, inhibited control wave activity (n = 3). Adenosine deaminase also prevented the induction of activity by L-type Ca2+ channel agonists (Fig.5A) (n = 3). In accordance, aminophylline (500 μm), a general adenosine receptor antagonist, blocked both control (Fig.5B1) (n = 3) and L-type Ca2+ channel agonist-potentiated waves (Fig. 5B2) (n = 4). Thus, L-type Ca2+ channel agonist-potentiated waves, like control retinal waves, require the activation of adenosine receptors by extracellular adenosine.
Fig. 5.

Normal and L-type Ca2+channel agonist-potentiated waves are dependent on adenosine receptor-mediated signaling. A, ΔF/Faveraged over a 200 μm2 area after incubation of retinas in adenosine deaminase (AD; 3 U/ml for 1 hr) under control conditions (top), after application of FPL and neurotransmitter antagonists (middle), and after washout of AD for 10 min (bottom). B1, ΔF/F averaged over a 200 μm2 area under control conditions (top), after bath application of aminophylline (bottom left), and after washout of aminophylline (bottom right). B2, ΔF/F averaged over a 200 μm2 area in the presence of FPL and neurotransmitter antagonists (top left), after bath application of aminophylline (top right), and after washout of aminophylline (bottom right).
Do L-type Ca2+ channel agonists potentiate waves by the same mechanism as forskolin? Bath application of forskolin (25 μm) to isolated mouse retinas decreased the interval between waves to 36.4 ± 16.8 sec (n = 7), similar to its effects on ferret and chick retinas (Catsicas et al., 1998;Stellwagen et al., 1999). In the presence of forskolin, however, retinal waves were blocked by the nicotinic antagonist, DHβE (2 μm) (n = 5; data not shown). These results are consistent with the hypothesis that the effects of forskolin on wave frequency are exerted upstream of acetylcholine release (Stellwagen et al., 1999). In contrast, the L-type Ca2+ channel agonists, FPL and BayK, act independently of fast neurotransmission. Additionally, retinal waves recorded in the presence of forskolin never became so large as to cover the entire retinal preparation. We conclude, then, that although adenosine secretion is required for wave generation, adenylate cyclase and L-type Ca2+ channel agonists act independently to potentiate retinal waves.
DISCUSSION
We demonstrated that L-type Ca2+channel agonists induce propagating activity independent of fast synaptic transmission in the developing mammalian retina. L-type Ca2+ channel agonist-induced waves share two important features with control retinal waves: a contribution from gap junction coupling and a dependence on signaling by extracellular adenosine. We conclude that activity arising from localized depolarization can be propagated through the developing mammalian retina by nonsynaptic pathways. Below, we present a model of retinal wave propagation that argues that the precise spatiotemporal properties of retinal waves depend on the source of local depolarization that initiates them.
Gap junctions and propagating neural activity
We found that gap junction coupling plays a role in correlating spontaneous activity in the developing mouse retina. First, we used tracer coupling and a novel combination of fluorescence imaging and electrophysiological recording to demonstrate that RGCs in the developing mouse retina are coupled functionally by gap junctions (Fig.1). This latter assay allowed us to verify that 18α-GA is an effective blocker of gap junctions. Second, we showed that blocking gap junctions reduces the domain size of control retinal waves and L-type Ca2+ channel agonist-potentiated waves without abolishing either, indicating that gap junction coupling plays an important role in determining the area over which a wave can spread. Our observation that a gap junction antagonist inhibits wave propagation but not initiation in the mouse retina differs from studies of chick retina in which blocking gap junctions eliminated all wave activity (Catsicas et al., 1998; Wong et al., 1998). Importantly, however, the concentrations of gap junction antagonists used in the studies of chick retina were several times higher than those used here. Third, although blocking gap junctions reduced the area of both control and L-type Ca2+ channel agonist-potentiated waves, it did not reduce the propagation velocity of L-type Ca2+ channel agonist-potentiated waves below control levels. This suggests that gap junction coupling is not the rate-limiting factor in wave propagation. It is important to note, also, that gap junctions between RGCs are not likely to be essential for retinal wave propagation because in ferret retinas, β-ganglion cells are not tracer-coupled to other RGCs (Penn et al., 1994), but they participate in waves (Wong et al., 1993). Rather, gap junctions between amacrine cells, or between ganglion and amacrine cells, may be the key components of the wave-propagating circuit.
Gap junction coupling correlates activity in neuronal populations in one of two ways, through either electrical or diffusional connectivity. Electrical coupling synchronizes activity in interneurons in a number of brain regions. The spontaneous firing of interneurons in the cerebellar cortex, for example (Mann-Metzer and Yarom, 1999), is tightly correlated because the cells are connected electrically. Alternately, gap junctions can allow small ions or second messengers produced or released in one neuron to diffuse into another. For example, in the developing neocortex, intercellular diffusion of inositol triphosphate causes coordinated release of Ca2+ from internal stores within groups of coupled neurons, called “domains” (Yuste et al., 1992; Kandler and Katz, 1998; Peinado, 2000).
Is the coupling that underlies retinal wave propagation primarily electrical or diffusional? Our fluorescence imaging studies of gap junction communication demonstrate that depolarization in one RGC induces a rapid increase of intracellular Ca2+ in other neurons (Fig. 1). Because these fluorescence changes occur rapidly, most likely they result from direct electrical coupling between neurons. It is also possible, however, that some type of diffusional coupling contributes to retinal wave propagation. Supporting this hypothesis is the observation that TTX, which, by blocking Na+ channels, reduces the abilities of neurons to propagate fast electrical signals, does not alter the frequency or propagation velocity of L-type Ca2+ channel agonist-potentiated waves. This observation raises the possibility that a regenerative intracellular process, like Ca2+-induced Ca2+ release, may contribute to retinal wave propagation via diffusional coupling.
Modulation of network activity by adenosine
We demonstrated that normal and L-type Ca2+ channel-potentiated waves in the mouse retina depend on signaling by extracellular adenosine. Our findings are consistent with those of Stellwagen et al. (1999), which indicate that the spatiotemporal properties of retinal waves (i.e., size, propagation velocity, and interwave interval) are modulated by endogenously released adenosine. In studies of neonatal ferret retinas,Stellwagen et al. (1999) found that depleting extracellular adenosine with adenosine deaminase blocked retinal waves completely, and adenosine receptor agonists increased the size, speed, and frequency of waves. Additionally, forskolin, which increases adenylate cyclase activity, mimicked the effects of adenosine agonists, and antagonists of adenylate cyclase and protein kinase A inhibited the activity of these agonists. Together, these observations indicated that adenosine stimulates wave activity by elevating cAMP.
Because nAChR antagonists blocked forskolin-potentiated waves in ferret retinas, Stellwagen et al. (1999) proposed that adenosine acted presynaptically to modulate the strength of cholinergic transmission. In contrast, we found that L-type Ca2+channel-potentiated waves occur in the absence of fast synaptic transmission, including cholinergic neurotransmission. L-type Ca2+ channel-potentiated waves are blocked, however, by an adenosine receptor antagonist and by adenosine deaminase. Taken together, our observations indicate that the primary site of adenosine-mediated modulation of retinal waves is downstream of synaptic transmission; this does not preclude, however, the possibility that there is an additional presynaptic site at which adenosine acts.
One possible mode of action for adenosine is the modulation of the strength of gap junction coupling between developing retinal neurons, because a number of studies demonstrated that gap junction conductance between many retinal interneurons is regulated by cAMP concentration (Piccolino et al., 1984; Lasater, 1987; Hampson et al., 1992). Our observations suggest that adenosine may modulate intercellular coupling in the developing inner retina, thereby setting the distance over which spontaneous activity can propagate. Additionally, adenosine may modulate intracellular concentrations of second messengers that can diffuse between cells through gap junctions.
Implications for retinal wave mechanisms
Previously, it was proposed that the interwave interval and well defined boundaries of retinal waves are derived from a tissue refractory period, defined as a finite time after activation of a retinal area during which that region cannot participate in subsequent waves (Feller et al., 1996, 1997; Butts et al., 1999). Here, we find that in the absence of fast synaptic transmission, L-type Ca2+ channel agonist-potentiated waves occur more frequently and cover more area, implying a significant reduction in the refractory period (Fig. 3). Hence, we propose that the refractory period is likely to arise primarily from the synaptic inputs that initiate these waves (Feller, 1999; O'Donovan, 1999).
On the basis of these findings, we advance a model of retinal wave propagation in which the mechanisms that propagate neural activity within the developing inner retina may be independent of the excitatory inputs that initiate it. Normally, small areas of the inner retina are excited by local, synaptically mediated depolarization and respond by propagating a spatially restricted retinal wave. When L-type Ca2+ channel agonists are applied to the entire retina, all of its component neurons are able to respond strongly to a small depolarizing stimulus, whether it is a synaptic input or a small membrane potential fluctuation. Under these conditions, depolarization in a small number of neurons triggers a rapidly propagating wave of neural activity that encompasses many cells.
The contribution of synaptic transmission to spontaneous activity generated in developing vertebrate retinas has been studied extensively, and these studies have revealed developmentally regulated changes in the neurotransmitter systems underlying network activity (for review, see Wong, 1999). Early in postnatal development, cholinergic neurotransmission mediated by nicotinic receptors is required for wave propagation in neonatal ferret, rabbit, and mouse retinas (Feller et al., 1996; Bansal et al., 2000; Zhou and Zhao, 2000) and for synchronized RGC bursting in embryonic turtle retinas (Sernagor and Grzywacz, 1999). Later in postnatal development, glutamatergic neurotransmission replaces cholinergic neurotransmission as a requisite for wave generation in mammalian retinas (Bansal et al., 2000; Wong et al., 2000; Zhou and Zhao, 2000). This transition is correlated with the appearance of glutamatergic bipolar cell terminals in the developing inner plexiform layer (IPL) (Miller et al., 1999), and it changes the spatiotemporal properties of retinal waves. Most notably, there arises a significant difference in the periodicity of bursting between “on” and “off” RGCs (Wong et al., 2000). This difference may be critical for the segregation of retinogeniculate axons into on and off layers in the LGN.
That cholinergic amacrine and glutamatergic bipolar cell circuits in the developing retina both can support propagating activity is puzzling, given that they differ dramatically both anatomically and functionally. Amacrine cell projections within the IPL mediate lateral interactions between inner retinal neurons, whereas bipolar cells are oriented vertically and span the inner and outer retina, linking photoreceptor output to RGCs (for review, see Wassle and Boycott, 1991). Our finding that L-type Ca2+channel agonist-potentiated waves can propagate independent of synaptic transmission offers an explanation of how seemingly diverse cholinergic and glutamatergic wave-generating circuits can produce propagating activity. A nonspecific mechanism of activity propagation permits developing retinal ganglion cells to continue to generate patterned, spontaneous neural output. This persistent patterned activity may be critical for directing activity-dependent refinement of connections at different developmental stages throughout the developing vertebrate visual system (Wong, 1999; Butts and Rokhsar, 2001).
Footnotes
This work was supported by the National Institute of Neurological Disorders and Stroke (NINDS) Intramural Research Program. J.H.S. is a Pharmacology Research Associate Training Fellow of the National Institute of General Medical Sciences. We thank Dr. Carolyn Smith of the Light Imaging Facility at NINDS for assistance with confocal microscopy.
Correspondence should be addressed to Dr. Joshua H. Singer, NIH/NINDS, 36 Convent Drive, MSC-4066, Building 36, Room 2C09, Bethesda, MD 20892-4066. E-mail: jhsinger@codon.nih.gov.
M. B. Feller's present address: Section of Neurobiology, Department of Biology, University of California San Diego, 9500 Gilman Drive, La Jolla, CA 92093.
REFERENCES
- 1.Baldridge WH, Vaney DI, Weiler R. The modulation of intercellular coupling in the retina. Semin Cell Dev Biol. 1998;9:311–318. doi: 10.1006/scdb.1998.0235. [DOI] [PubMed] [Google Scholar]
- 2.Bansal A, Singer JH, Hwang B, Xu W, Beaudet A, Feller MB. Mice lacking specific nicotinic receptor subunits exhibit dramatically altered spontaneous activity patterns and reveal a limited role for retinal waves in forming on-off circuits in the inner retina. J Neurosci. 2000;20:7672–7681. doi: 10.1523/JNEUROSCI.20-20-07672.2000. [DOI] [PMC free article] [PubMed] [Google Scholar]
- 3.Beierlein M, Gibson JR, Connors BW. A network of electrically coupled interneurons drives synchronized inhibition in neocortex. Nat Neurosci. 2000;3:904–910. doi: 10.1038/78809. [DOI] [PubMed] [Google Scholar]
- 4.Burgi PY, Grzywacz NM. Model for the pharmacological basis of spontaneous synchronous activity in developing retinas. J Neurosci. 1994;14:7426–7439. doi: 10.1523/JNEUROSCI.14-12-07426.1994. [DOI] [PMC free article] [PubMed] [Google Scholar]
- 5.Butts DA, Rokhsar DS. The information content of retinal waves. J Neurosci. 2001;21:961–973. doi: 10.1523/JNEUROSCI.21-03-00961.2001. [DOI] [PMC free article] [PubMed] [Google Scholar]
- 6.Butts DA, Feller MB, Shatz CJ, Rokhsar DS. Retinal waves are governed by collective network properties. J Neurosci. 1999;19:3580–3593. doi: 10.1523/JNEUROSCI.19-09-03580.1999. [DOI] [PMC free article] [PubMed] [Google Scholar]
- 7.Catsicas M, Bonness V, Becker D, Mobbs P. Spontaneous Ca2+ transients and their transmission in the developing chick retina. Curr Biol. 1998;8:283–286. doi: 10.1016/s0960-9822(98)70110-1. [DOI] [PubMed] [Google Scholar]
- 8.Chang Q, Balice-Gordon RJ. Gap junctional communication among developing and injured motor neurons. Brain Res Brain Res Rev. 2000;32:242–249. doi: 10.1016/s0165-0173(99)00085-5. [DOI] [PubMed] [Google Scholar]
- 9.Chang Q, Gonzalez M, Pinter MJ, Balice-Gordon RJ. Gap junctional coupling and patterns of connexin expression among neonatal rat lumbar spinal motor neurons. J Neurosci. 1999;19:10813–10828. doi: 10.1523/JNEUROSCI.19-24-10813.1999. [DOI] [PMC free article] [PubMed] [Google Scholar]
- 10.Christie MJ, Williams JT, North RA. Electrical coupling synchronizes subthreshold activity in locus coeruleus neurons in vitro from neonatal rats. J Neurosci. 1989;9:3584–3589. doi: 10.1523/JNEUROSCI.09-10-03584.1989. [DOI] [PMC free article] [PubMed] [Google Scholar]
- 11.Connors BW, Benardo LS, Prince DA. Coupling between neurons of the developing rat neocortex. J Neurosci. 1983;3:773–782. doi: 10.1523/JNEUROSCI.03-04-00773.1983. [DOI] [PMC free article] [PubMed] [Google Scholar]
- 12.Davidson JS, Baumgarten IM. Glycyrrhetinic acid derivatives: a novel class of inhibitors of gap-junctional intercellular communication. Structure-activity relationships. J Pharmacol Exp Ther. 1988;246:1104–1107. [PubMed] [Google Scholar]
- 13.Davidson JS, Baumgarten IM, Harley EH. Reversible inhibition of intercellular junctional communication by glycyrrhetinic acid. Biochem Biophys Res Commun. 1986;134:29–36. doi: 10.1016/0006-291x(86)90522-x. [DOI] [PubMed] [Google Scholar]
- 14.De Zeeuw CI, Simpson JI, Hoogenraad CC, Galjart N, Koekkoek SK, Ruigrok TJ. Microcircuitry and function of the inferior olive. Trends Neurosci. 1998;21:391–400. doi: 10.1016/s0166-2236(98)01310-1. [DOI] [PubMed] [Google Scholar]
- 15.Doi M, Uji Y, Yamamura H. Morphological classification of retinal ganglion cells in mice. J Comp Neurol. 1995;356:368–386. doi: 10.1002/cne.903560305. [DOI] [PubMed] [Google Scholar]
- 16.Feller MB. Spontaneous correlated activity in developing neural circuits. Neuron. 1999;22:653–656. doi: 10.1016/s0896-6273(00)80724-2. [DOI] [PubMed] [Google Scholar]
- 17.Feller MB, Wellis DP, Stellwagen D, Werblin FS, Shatz CJ. Requirement for cholinergic synaptic transmission in the propagation of spontaneous retinal waves. Science. 1996;272:1182–1187. doi: 10.1126/science.272.5265.1182. [DOI] [PubMed] [Google Scholar]
- 18.Feller MB, Butts DA, Aaron HL, Rokhsar DS, Shatz CJ. Dynamic processes shape spatiotemporal properties of retinal waves. Neuron. 1997;19:293–306. doi: 10.1016/s0896-6273(00)80940-x. [DOI] [PubMed] [Google Scholar]
- 19.Fukuda T, Kosaka T. Gap junctions linking the dendritic network of GABAergic interneurons in the hippocampus. J Neurosci. 2000;20:1519–1528. doi: 10.1523/JNEUROSCI.20-04-01519.2000. [DOI] [PMC free article] [PubMed] [Google Scholar]
- 20.Galarreta M, Hestrin S. A network of fast-spiking cells in the neocortex connected by electrical synapses. Nature. 1999;402:72–75. doi: 10.1038/47029. [DOI] [PubMed] [Google Scholar]
- 21.Gleason E, Borges S, Wilson M. Control of transmitter release from retinal amacrine cells by Ca2+ influx and efflux. Neuron. 1994;13:1109–1117. doi: 10.1016/0896-6273(94)90049-3. [DOI] [PubMed] [Google Scholar]
- 22.Hampson EC, Vaney DI, Weiler R. Dopaminergic modulation of gap junction permeability between amacrine cells in mammalian retina. J Neurosci. 1992;12:4911–4922. doi: 10.1523/JNEUROSCI.12-12-04911.1992. [DOI] [PMC free article] [PubMed] [Google Scholar]
- 23.Hartveit E. Reciprocal synaptic interactions between rod bipolar cells and amacrine cells in the rat retina. J Neurophysiol. 1999;81:2923–2936. doi: 10.1152/jn.1999.81.6.2923. [DOI] [PubMed] [Google Scholar]
- 24.Hounsgaard J, Kiehn O. Serotonin-induced bistability of turtle motoneurones caused by a nifedipine-sensitive calcium plateau potential. J Physiol (Lond) 1989;414:265–282. doi: 10.1113/jphysiol.1989.sp017687. [DOI] [PMC free article] [PubMed] [Google Scholar]
- 25.Kandler K, Katz LC. Neuronal coupling and uncoupling in the developing nervous system. Curr Opin Neurobiol. 1995;5:98–105. doi: 10.1016/0959-4388(95)80093-x. [DOI] [PubMed] [Google Scholar]
- 26.Kandler K, Katz LC. Coordination of neuronal activity in developing visual cortex by gap junction-mediated biochemical communication. J Neurosci. 1998;18:1419–1427. doi: 10.1523/JNEUROSCI.18-04-01419.1998. [DOI] [PMC free article] [PubMed] [Google Scholar]
- 27.Lasater EM. Retinal horizontal cell gap junctional conductance is modulated by dopamine through a cyclic AMP-dependent protein kinase. Proc Natl Acad Sci USA. 1987;84:7319–7323. doi: 10.1073/pnas.84.20.7319. [DOI] [PMC free article] [PubMed] [Google Scholar]
- 28.Llinas R, Baker R, Sotelo C. Electrotonic coupling between neurons in cat inferior olive. J Neurophysiol. 1974;37:560–571. doi: 10.1152/jn.1974.37.3.560. [DOI] [PubMed] [Google Scholar]
- 29.Mann-Metzer P, Yarom Y. Electrotonic coupling interacts with intrinsic properties to generate synchronized activity in cerebellar networks of inhibitory interneurons. J Neurosci. 1999;19:3298–3306. doi: 10.1523/JNEUROSCI.19-09-03298.1999. [DOI] [PMC free article] [PubMed] [Google Scholar]
- 30.Matthews G. Synaptic mechanisms of bipolar cell terminals. Vision Res. 1999;39:2469–2476. doi: 10.1016/s0042-6989(98)00249-1. [DOI] [PubMed] [Google Scholar]
- 31.Miller ED, Tran MN, Wong GK, Oakley DM, Wong RO. Morphological differentiation of bipolar cells in the ferret retina. Vis Neurosci. 1999;16:1133–1144. doi: 10.1017/s0952523899166136. [DOI] [PubMed] [Google Scholar]
- 32.Mills SL, Massey SC. A series of biotinylated tracers distinguishes three types of gap junction in retina. J Neurosci. 2000;20:8629–8636. doi: 10.1523/JNEUROSCI.20-22-08629.2000. [DOI] [PMC free article] [PubMed] [Google Scholar]
- 33.O'Donovan MJ. The origin of spontaneous activity in developing networks of the vertebrate nervous system. Curr Opin Neurobiol. 1999;9:94–104. doi: 10.1016/s0959-4388(99)80012-9. [DOI] [PubMed] [Google Scholar]
- 34.Peichl L, Buhl EH, Boycott BB. Alpha ganglion cells in the rabbit retina. J Comp Neurol. 1987;263:25–41. doi: 10.1002/cne.902630103. [DOI] [PubMed] [Google Scholar]
- 35. Peinado A. Traveling slow waves of neural activity: a novel form of network activity in developing neocortex. J Neurosci 20 2000. RC54:1–6. [DOI] [PMC free article] [PubMed] [Google Scholar]
- 36.Peinado A, Yuste R, Katz LC. Gap junctional communication and the development of local circuits in neocortex. Cereb Cortex. 1993;3:488–498. doi: 10.1093/cercor/3.5.488. [DOI] [PubMed] [Google Scholar]
- 37.Penn AA, Riquelme PA, Feller MB, Shatz CJ. Competition in retinogeniculate patterning driven by spontaneous activity. Science. 1998;279:2108–2112. doi: 10.1126/science.279.5359.2108. [DOI] [PubMed] [Google Scholar]
- 38.Penn AA, Wong RO, Shatz CJ. Neuronal coupling in the developing mammalian retina. J Neurosci. 1994;14:3805–3815. doi: 10.1523/JNEUROSCI.14-06-03805.1994. [DOI] [PMC free article] [PubMed] [Google Scholar]
- 39.Perez VJ, Carlen PL. Gap junctions, synchrony and seizures. Trends Neurosci. 2000;23:68–74. doi: 10.1016/s0166-2236(99)01497-6. [DOI] [PubMed] [Google Scholar]
- 40.Perez-Velazquez JL, Valiante TA, Carlen PL. Modulation of gap junctional mechanisms during calcium-free induced field burst activity: a possible role for electrotonic coupling in epileptogenesis. J Neurosci. 1994;14:4308–4317. doi: 10.1523/JNEUROSCI.14-07-04308.1994. [DOI] [PMC free article] [PubMed] [Google Scholar]
- 41.Piccolino M, Neyton J, Gerschenfeld HM. Decrease of gap junction permeability induced by dopamine and cyclic adenosine 3′:5′-monophosphate in horizontal cells of turtle retina. J Neurosci. 1984;4:2477–2488. doi: 10.1523/JNEUROSCI.04-10-02477.1984. [DOI] [PMC free article] [PubMed] [Google Scholar]
- 42. Rekling JC, Shao XM, Feldman JL. Electrical coupling and excitatory synaptic transmission between rhythmogenic respiratory neurons in the PreBotzinger complex. J Neurosci 20 2000. RC113:1–5. [DOI] [PMC free article] [PubMed] [Google Scholar]
- 43.Roerig B, Feller MB. Neurotransmitters and gap junctions in developing neural circuits. Brain Res Brain Res Rev. 2000;32:86–114. doi: 10.1016/s0165-0173(99)00069-7. [DOI] [PubMed] [Google Scholar]
- 44.Schmitz Y, Witkovsky P. Dependence of photoreceptor glutamate release on a dihydropyridine-sensitive calcium channel. Neuroscience. 1997;78:1209–1216. doi: 10.1016/s0306-4522(96)00678-1. [DOI] [PubMed] [Google Scholar]
- 45.Schwartz TH, Rabinowitz D, Unni V, Kumar VS, Smetters DK, Tsiola A, Yuste R. Networks of coactive neurons in developing layer 1. Neuron. 1998;20:541–552. doi: 10.1016/s0896-6273(00)80993-9. [DOI] [PubMed] [Google Scholar]
- 46.Sernagor E, Grzywacz NM. Spontaneous activity in developing turtle retinal ganglion cells: pharmacological studies. J Neurosci. 1999;19:3874–3887. doi: 10.1523/JNEUROSCI.19-10-03874.1999. [DOI] [PMC free article] [PubMed] [Google Scholar]
- 47. Sernagor E, Eglen SJ, O'Donovan MJ. Differential effects of acetylcholine and glutamate blockade on the spatiotemporal dynamics of retinal waves. J Neurosci 20 2000. RC56:1–6. [DOI] [PMC free article] [PubMed] [Google Scholar]
- 48.Shatz CJ. Emergence of order in visual system development. Proc Natl Acad Sci USA. 1996;93:602–608. doi: 10.1073/pnas.93.2.602. [DOI] [PMC free article] [PubMed] [Google Scholar]
- 49.Stellwagen D, Shatz CJ, Feller MB. Dynamics of retinal waves are controlled by cyclic AMP. Neuron. 1999;24:673–685. doi: 10.1016/s0896-6273(00)81121-6. [DOI] [PubMed] [Google Scholar]
- 50.Tagawa Y, Sawai H, Ueda Y, Tauchi M, Nakanishi S. Immunohistological studies of metabotropic glutamate receptor subtype 6-deficient mice show no abnormality of retinal cell organization and ganglion cell maturation. J Neurosci. 1999;19:2568–2579. doi: 10.1523/JNEUROSCI.19-07-02568.1999. [DOI] [PMC free article] [PubMed] [Google Scholar]
- 51.Tresch MC, Kiehn O. Motor coordination without action potentials in the mammalian spinal cord. Nat Neurosci. 2000;3:593–599. doi: 10.1038/75768. [DOI] [PubMed] [Google Scholar]
- 52.Venance L, Rozov A, Blatow M, Burnashev N, Feldmeyer D, Monyer H. Connexin expression in electrically coupled postnatal rat brain neurons. Proc Natl Acad Sci USA. 2000;97:10260–10265. doi: 10.1073/pnas.160037097. [DOI] [PMC free article] [PubMed] [Google Scholar]
- 53.Wassle H, Boycott BB. Functional architecture of the mammalian retina. Physiol Rev. 1991;71:447–480. doi: 10.1152/physrev.1991.71.2.447. [DOI] [PubMed] [Google Scholar]
- 54.Witkovsky P, Schmitz Y, Akopian A, Krizaj D, Tranchina D. Gain of rod to horizontal cell synaptic transfer: relation to glutamate release and a dihydropyridine-sensitive calcium current. J Neurosci. 1997;17:7297–7306. doi: 10.1523/JNEUROSCI.17-19-07297.1997. [DOI] [PMC free article] [PubMed] [Google Scholar]
- 55.Wong RO. Retinal waves and visual system development. Annu Rev Neurosci. 1999;22:29–47. doi: 10.1146/annurev.neuro.22.1.29. [DOI] [PubMed] [Google Scholar]
- 56.Wong RO, Oakley DM. Changing patterns of spontaneous bursting activity of on and off retinal ganglion cells during development. Neuron. 1996;16:1087–1095. doi: 10.1016/s0896-6273(00)80135-x. [DOI] [PubMed] [Google Scholar]
- 57.Wong RO, Meister M, Shatz CJ. Transient period of correlated bursting activity during development of the mammalian retina. Neuron. 1993;11:923–938. doi: 10.1016/0896-6273(93)90122-8. [DOI] [PubMed] [Google Scholar]
- 58.Wong RO, Chernjavsky A, Smith SJ, Shatz CJ. Early functional neural networks in the developing retina. Nature. 1995;374:716–718. doi: 10.1038/374716a0. [DOI] [PubMed] [Google Scholar]
- 59.Wong WT, Sanes JR, Wong RO. Developmentally regulated spontaneous activity in the embryonic chick retina. J Neurosci. 1998;18:8839–8852. doi: 10.1523/JNEUROSCI.18-21-08839.1998. [DOI] [PMC free article] [PubMed] [Google Scholar]
- 60.Wong WT, Myhr KL, Miller ED, Wong RO. Developmental changes in the neurotransmitter regulation of correlated spontaneous retinal activity. J Neurosci. 2000;20:351–360. doi: 10.1523/JNEUROSCI.20-01-00351.2000. [DOI] [PMC free article] [PubMed] [Google Scholar]
- 61.Xu W, Orr-Urtreger A, Nigro F, Gelber S, Sutcliffe CB, Armstrong D, Patrick JW, Role LW, Beaudet AL, De Biasi M. Multiorgan autonomic dysfunction in mice lacking the beta2 and the beta4 subunits of neuronal nicotinic acetylcholine receptors. J Neurosci. 1999;19:9298–9305. doi: 10.1523/JNEUROSCI.19-21-09298.1999. [DOI] [PMC free article] [PubMed] [Google Scholar]
- 62.Yuste R, Peinado A, Katz LC. Neuronal domains in developing neocortex. Science. 1992;257:665–669. doi: 10.1126/science.1496379. [DOI] [PubMed] [Google Scholar]
- 63.Zhou ZJ. Direct participation of starburst amacrine cells in spontaneous rhythmic activities in the developing mammalian retina. J Neurosci. 1998;18:4155–4165. doi: 10.1523/JNEUROSCI.18-11-04155.1998. [DOI] [PMC free article] [PubMed] [Google Scholar]
- 64.Zhou ZJ, Zhao D. Coordinated transitions in neurotransmitter systems for the initiation and propagation of spontaneous retinal waves. J Neurosci. 2000;20:6570–6577. doi: 10.1523/JNEUROSCI.20-17-06570.2000. [DOI] [PMC free article] [PubMed] [Google Scholar]