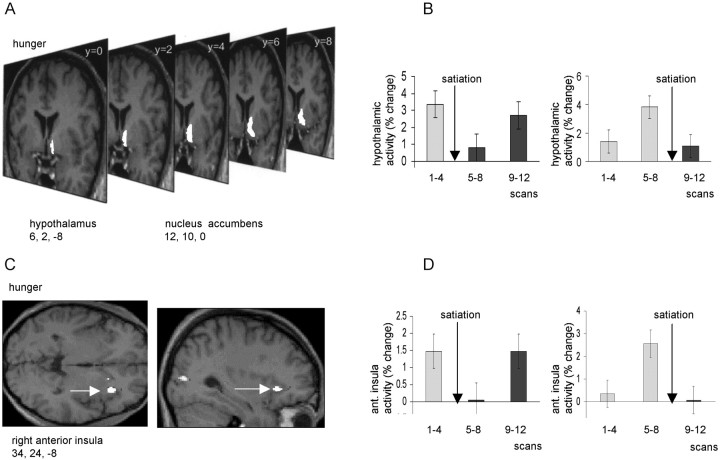
Fig. 4.
A, An SPM showing activations in hypothalamus and ventral striatum (nucleus accumbens) that covaried positively with subjective ratings of hunger. The activations are displayed on serial coronal MRI sections from a representative subject.B, Mean hypothalamic activity across three scanning blocks (i.e., scans 1–4, 5–8, and 9–12) are shown for early and late satiation groups. C, An SPM showing an activation in right insula that covaried positively with subjective ratings of hunger. The activation is displayed on sagittal and transverse MRI sections from a representative subject. Right insula is indicated by awhite arrow. D, Mean insula activity is shown (in terms of percentage signal change) for early and late satiation groups. In B and D, bars represent 2 SEs, and arrows indicate time of satiation.

