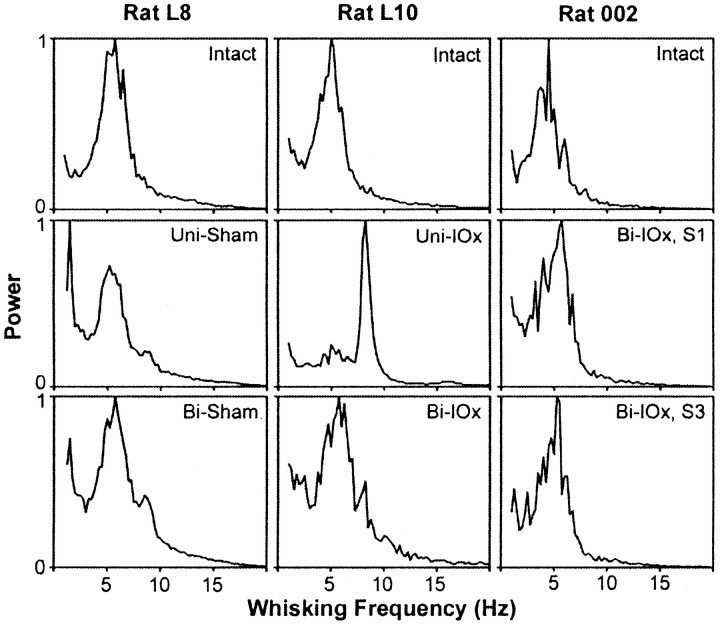
Fig. 10.
Trigeminal deafferentation and whisking rhythmicity. Plots of Fourier power spectra before and after sham (left), sequentially (middle), and during the first and third sessions (S1 and S3, respectively) after a one-stage bilateral deafferentation of the whiskers (right). For clarity, only data for a single whisker are presented, although effects were similar in both whiskers.

