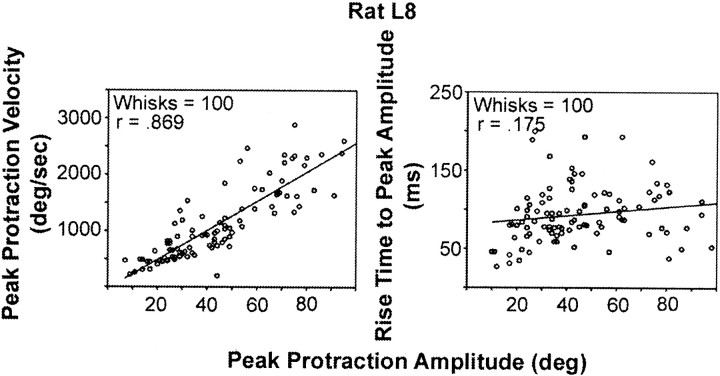
Fig. 4.
Amplitude scaling of protraction movements: relative contributions of protraction velocity and rise time variables. Plots are based on 100 randomly selected whisks from a single representative animal. Left, Relationship between protraction amplitude and peak velocity. Right, Relationship between protraction amplitude and rise time to peak protraction amplitude.

