
Fig. 9.
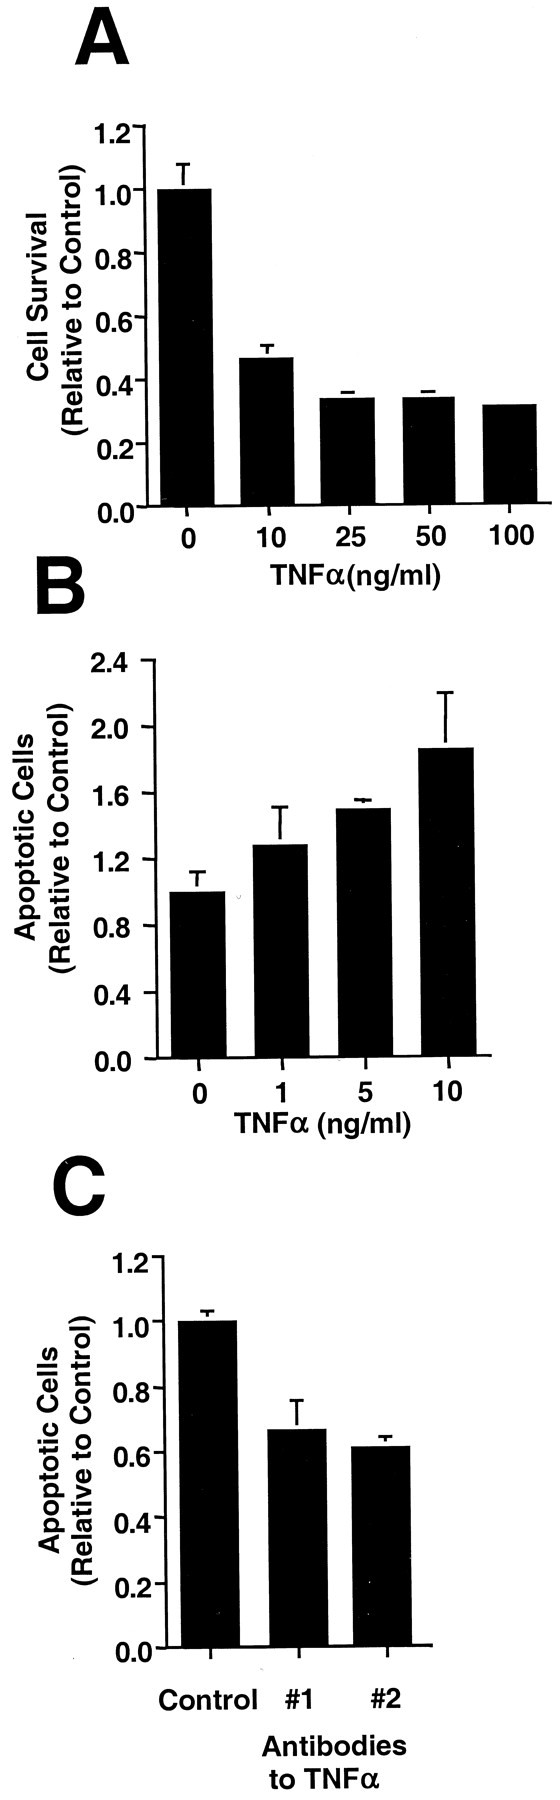
FGF2-treated H19-7 cells undergo apoptosis after TNFα treatment. H19-7 cells were shifted to N2 + FGF2 and treated with the indicated concentrations of TNFα. A, Cell survival was determined by counting 1 d after the addition of the TNFα. These data are from one of three experiments for all concentrations except 100 ng/ml (for 10, 25, or 50 ng/ml TNFα,p = 0.001). B, One day after TNFα treatment, apoptotic cells were detected with Höechst 33342. These data are representative of three experiments (for 5 or 10 ng/ml TNFα, p = 0.001). The control cells inA and B are treated with FGF2 but not TNFα. C, Control IgG, goat anti-rat TNFα (#1), or hamster anti-mouse TNFα (#2) at 5 μg/ml was added to the cultures at the time of the temperature and medium switch, and apoptotic cells were counted 2 d later. These data are from one of five experiments (p = 0.01).