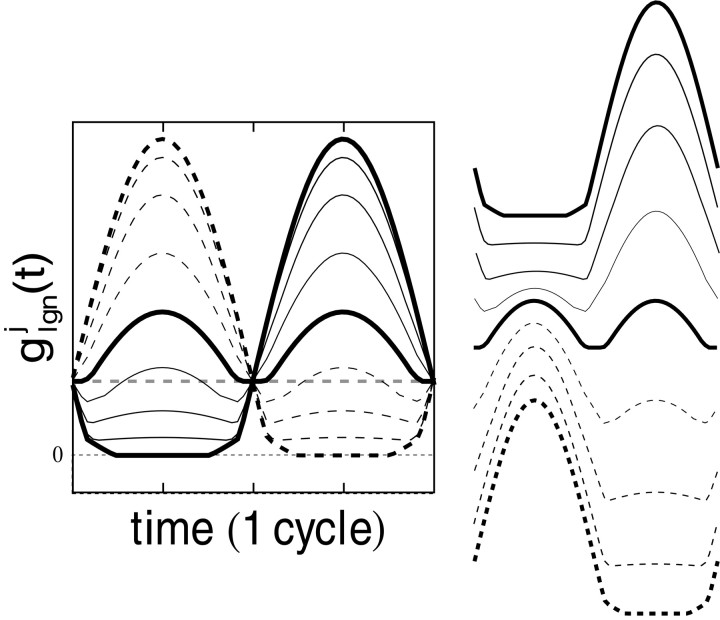
Fig. 2.
In the model, the conductance received by the j th cortical neuron from the LGN, g (t): From contrast reversal gratings (at preferred orientation, 100% contrast, optimal spatial and temporal frequencies). Responses to nine different grating spatial phases (φ = φ + iπ/8, i = 0, 1, 2, … , 8) are shown. One thick curve is the maximal “in-phase” case (φ = φ ); and the second thick curve is the minimal “orthogonal phase” case (φ = φ + π/2). For contrast reversal results, the time axis has been translated so that t = 0 corresponds to the initial arrival of excitations in V1 from the LGN. On theright side of the figure, the different response waveforms have been separated vertically to correspond to the data format of Figure 1.

