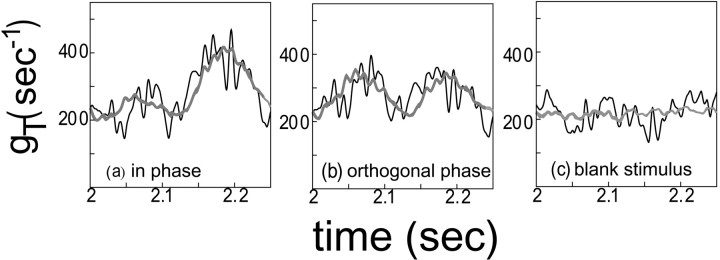
Fig. 4.
The total conductance for the in-phase stimulus (a), the orthogonal phase stimulus (b), and the blank stimulus (c). The cycle averaged conductance T (averaged over 24 cycles) is shown as athick gray curve, superimposed on the (less smooth) instantaneous conductance gT over one cycle (4 Hz contrast reversal stimulus). These are simulations for the near neuron in the fully-coupled network in Figure 3.

