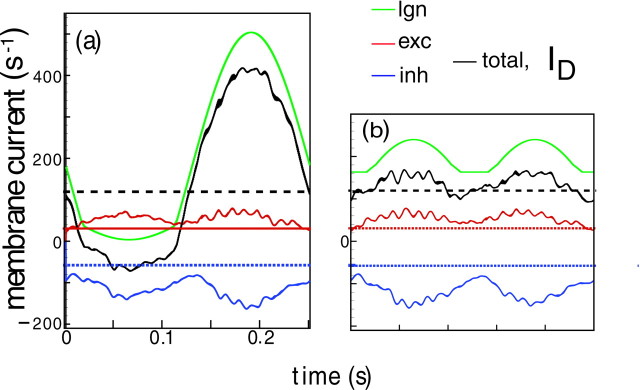
Fig. 5.
Cycle-averaged currents (averaged over 24 cycles) comprising D, for an excitatory neuron in the coupled network, in response to in-phase (a) and orthogonal phase (b) stimulus. Plotted are the LGN (green), cortical excitatory (red) and cortical inhibitory (blue), and grand total (black) currents. Also plotted are the mean values of the excitatory (red dotted) and inhibitory noises (blue dotted), and total background current (black dotted line).

