
Fig. 1.
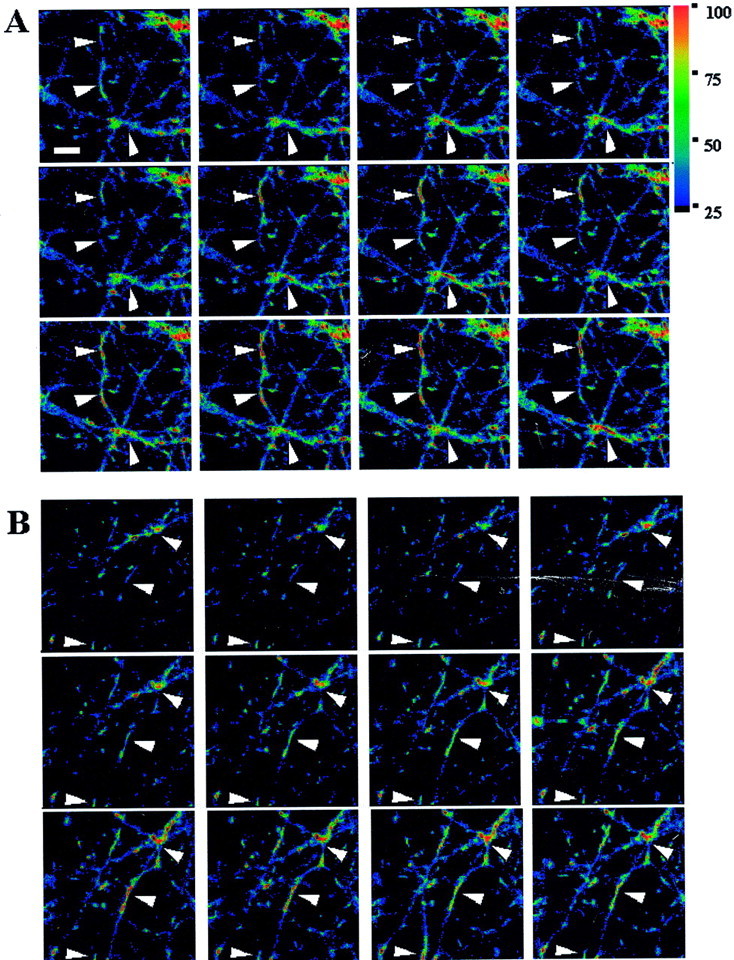
Representative fluorescent images of ΔΨm fluctuations. A, JC-1-loaded neuronal processes. B, TMRM-loaded processes. Thesepanels show spontaneous changes in fluorescent intensity occurring in small regions of neuronal processes. Images show a 200 × 200 pixel field. Images were taken 30 sec apart.Arrowheads identify examples of regions of fluorescence that correspond to the expected size and shape of neuronal mitochondria and show readily observed fluctuations in intensity. Increases in fluorescence imply depolarization. TMRM-loaded cells have lower basal fluorescence because light levels were kept low to avoid light-induced increase in fluorescence. Scale bar, 10 μm. Movie files corresponding to JC-1-loaded (A) and TMRM-loaded (B) neurons have been included in the supplemental data section located in the on-line version of this article. Movie images were taken 5 sec apart, and time is shown in minutes and seconds. Both spontaneous fluctuations and dye intensity and mitochondrial motility are evident.