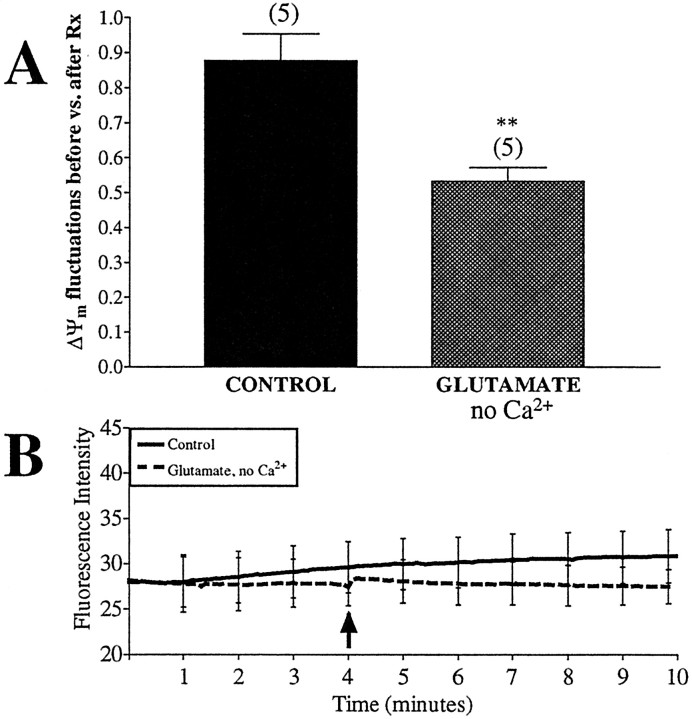
Fig. 11.
ΔΨm fluctuations are decreased after treatment with glutamate in a calcium-free buffer. Untreated neurons were loaded with JC-1 and imaged for 4 min before the addition of drug (arrow). Glutamate (100 μm,with 10 μm glycine) was perfused over the cells in a Ca2+-free buffer for 5 min. Fluorescence intensity and number of fluctuations per minute per 1000 ROIs were calculated. Glutamate in the presence of Ca2+ caused mitochondrial depolarization and thus was not tested. A, The ratio of fluctuations occurring during baseline to those occurring after drug treatment. Data are presented as means ± SEM, and thenumbers above each bar equal the number of fields imaged (∼1000 ROIs per field). Glutamate in Ca2+-free buffer significantly decreased the number of spontaneous fluctuations (t = 4.04; df = 8; **p < 0.01). B, Average fluorescence intensity of all mitochondria imaged, with representative error bars indicating SEM. Glutamate (no Ca2+) treatment did not alter basal fluorescence.

