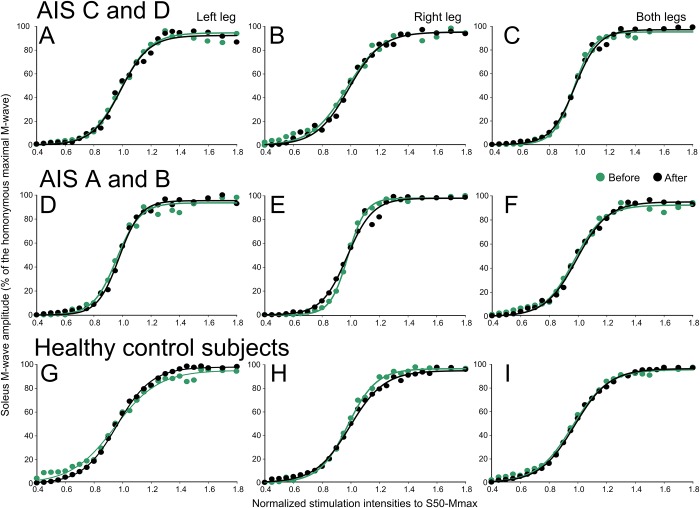
Fig 2. Soleus M-wave recruitment curves before and after repeated cathodal transspinal stimulation in individuals with and without SCI.
Soleus M-wave sizes as a percentage of the Mmax are plotted against the predicted multiples of 50% of maximal M-wave stimulus intensity (S50-Mmax) for left and right legs grouped for AIS C- D, AIS A-B, and healthy control subjects. Error bars not indicated for clarity purposes.

