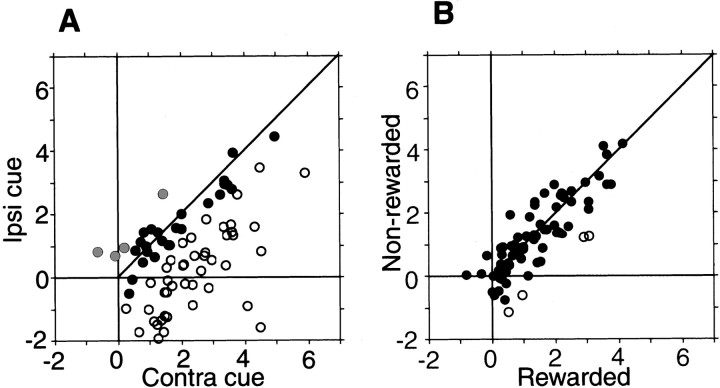
Fig. 7.
Spatial selectivity (A) and reward-related selectivity (B) of TANs. Data for all TANs that showed statistically significant cue responses in 1DR (n = 73). For each TAN (represented by acircle), the mean depth of inhibitory modulation (control test, Hertz) is compared between two conditions; a minus value indicates an increase in activity. In A the depth of inhibitory modulation is shown for the contralateral (Contra) (abscissa) and the ipsilateral (Ipsi) cues (ordinate). Open circles and gray circles indicate neurons with responses (i.e., depths of inhibitory modulation) that were significantly stronger and weaker, respectively, in response to the contralateral cues than to the ipsilateral cues (Mann–WhitneyU test, p < 0.05). Filled circles indicate neurons that showed no statistical differences. Paired comparison also indicates that these neurons showed stronger inhibitory response for contralateral cues than for ipsilateral cues (paired t test, p< 0.0001). In B the modulation is shown for the rewarded cues (abscissa) and the nonrewarded cues (ordinate). Open circles indicate neurons with responses that were significantly stronger to the rewarded cues than to the nonrewarded cues. In general, these neurons showed little difference in the magnitude of response between these two conditions (paired t test, p = 0.04).

